Oracle Database Metrics Exporter hands-on
Table of contents
Preamble
Oracle Database Metrics Exporter is the open source answer from Oracle to provide Open Telemetry and Prometheus-compatible metrics that integrate into your enterprise monitoring tool. I have already tested this Prometheus / Grafana infrastructure stack with Linux servers and MariaDB so it is really nice to see this Oracle open source initiative.
I will go fast, in this blog post, in Prometheus and Grafana configuration as we have already seen it…
Oracle is providing a default Oracle dashboard but I have tried to go a little bit further to understand how to customize dashboard and add new metrics to be displayed…
My testing has been done with:
- Prometheus 3.9.1
- Grafana Enterprise 12.3.3
- Prometheus / Grafana server with 12 cores and 64GB memory running with Red Hat Enterprise Linux release 8.10 (Ootpa)
- Database server running Red Hat Enterprise Linux release 8.6 (Ootpa) with 8 cores and 256Gb memory. Oracle is Enterprise edition 19c (19.25)
- Oracle AI Database Metrics Exporter 2.2.1
Prometheus configuration
I have untar Prometheus in a directory and created below aliases in my account profile to be able to control stop/start and restart:
alias start_prometheus='cd ~/prometheus-3.9.1.linux-amd64; nohup ./prometheus --config.file=prometheus.yml > ~/prometheus.log 2>&1 &'
alias stop_prometheus="kill \$(ps -ef | grep prometheus.yml | grep -v grep | awk '{print \$2}')"
alias restart_prometheus="kill -HUP \$(ps -ef | grep prometheus.yml | grep -v grep | awk '{print \$2}')"
In prometheus.yml configuration file I have just customize my server name:
# my global config
global:
  scrape_interval: 15s # Set the scrape interval to every 15 seconds. Default is every 1 minute.
  evaluation_interval: 15s # Evaluate rules every 15 seconds. The default is every 1 minute.
  # scrape_timeout is set to the global default (10s).

# Alertmanager configuration
alerting:
  alertmanagers:
    - static_configs:
        - targets:
          # - alertmanager:9093

# Load rules once and periodically evaluate them according to the global 'evaluation_interval'.
rule_files:
  # - "first_rules.yml"
  # - "second_rules.yml"

# A scrape configuration containing exactly one endpoint to scrape:
# Here it's Prometheus itself.
scrape_configs:
  # The job name is added as a label `job=` to any timeseries scraped from this config.
  - job_name: "prometheus"

    # metrics_path defaults to '/metrics'
    # scheme defaults to 'http'.

    static_configs:
      - targets: ["prometheus_server.domain.com:9090"]
       # The label name is added as a label `label_name=` to any timeseries scraped from this config.
        labels:
          app: "prometheus"
Start is with start_prometheus alias and you are done for Prometheus part !
Oracle Database Metrics Exporter installation
I have downloaded Oracle Instant client 23.26.1 basic for Linux x86-64 and all the version of Oracle Database Metrics Exporter (glibc 2.28 and normal one).
Even if my database serer is running RedHat 8.6 the Oracle Database Metrics Exporter “normal” version is not requiring Glibc 2.34 or above that is available only with RedHat 9:
[oraagent@database_server oracledb_exporter-2.2.1.linux-amd64]$ ldd oracledb_exporter
        linux-vdso.so.1 (0x00007ffdad1ab000)
        libresolv.so.2 => /lib64/libresolv.so.2 (0x00007f125bb24000)
        libdl.so.2 => /lib64/libdl.so.2 (0x00007f125b920000)
        libpthread.so.0 => /lib64/libpthread.so.0 (0x00007f125b700000)
        libc.so.6 => /lib64/libc.so.6 (0x00007f125b329000)
        /lib64/ld-linux-x86-64.so.2 (0x00007f125bd3c000)
From Oracle Database Metrics Exporter I have also downloaded default-metrics.toml, custom-metrics.toml and the default export config.yaml file.
I have slightly configure it to configure username, password, url and log_file. This is justa trial, never ever put password in clear in configuration file (at least do a chmod 600 on those files). You can use environment variables for increased security or best secure option an Oracle Wallet. My config.yaml file:
databases:
  database_server.domain.com_sid:
    username: dbsnmp
    password: "secure_password001!*"
    url: database_server.domain.com:1556/sid

    queryTimeout: 5

metrics:
  default: default-metrics.toml
  custom:
    - custom-metrics.toml

log:
  interval: 15s
  disable: 1
I configure ORACLE_HOME to point to my Instant client and LD_LIBRARY_PATH in same location because default value would be $ORACLE_HOME/lib.
Start the Oracle Database Metrics Exporter with:
nohup ./oracledb_exporter --config.file=config.yaml > ~/oracledb_exporter.log 2>&1 &
Then add at the end of your Prometheus configuration file (prometheus.yml) and use restart_prometheus alias we created earlier:
- job_name: "database_server.domain.com_sid"
  static_configs:
    - targets: ["database_server.domain.com:9161"]
      labels:
        app: "database_server.domain.com_sid"
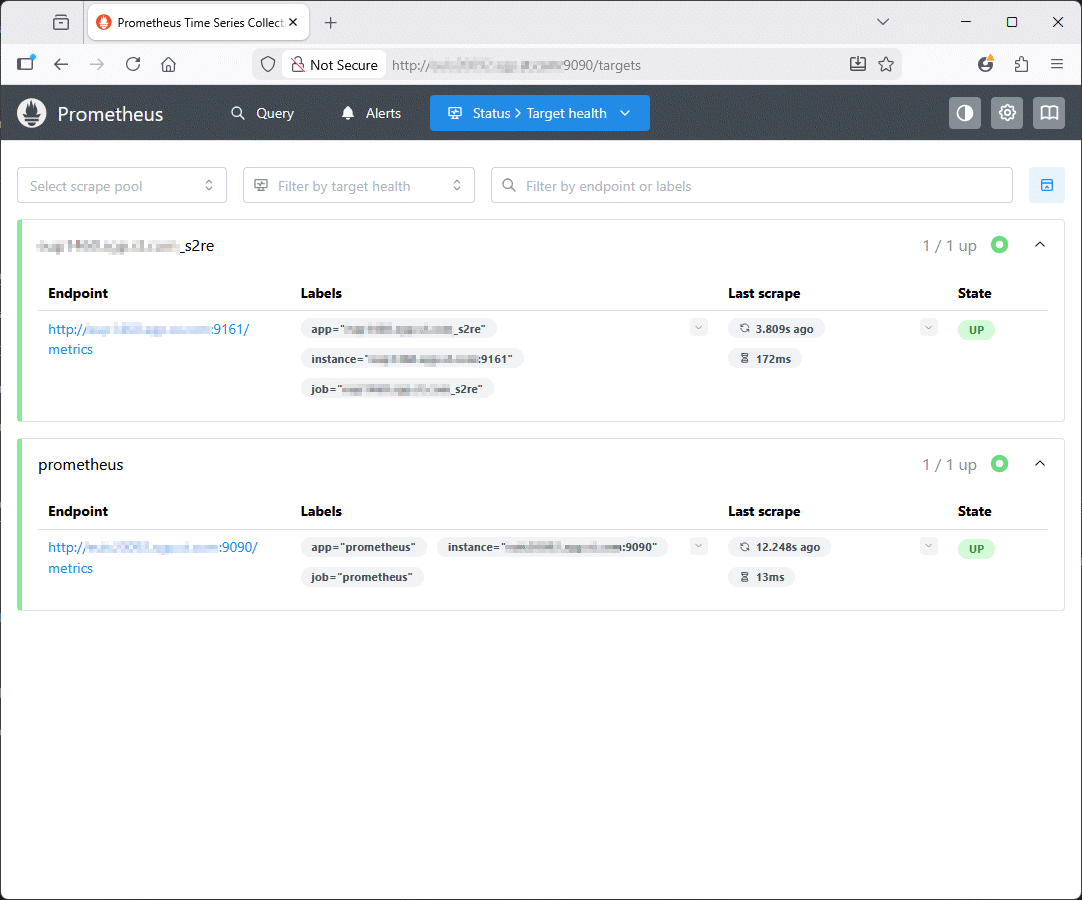
Then your new target should appear in Prometheus:
Grafana
I have untar Grafana in it standard directory (grafana-12.3.3) and created the three below aliases to ease my life:
alias start_grafana='cd ~/grafana-12.3.3/; nohup ./bin/grafana server > ~/grafana.log 2>&1 &'
alias stop_grafana="kill \$(ps -ef | grep grafana | grep -v grep | awk '{print \$2}')"
alias restart_grafana="kill -HUP \$(ps -ef | grep grafana | grep -v grep | awk '{print \$2}')"
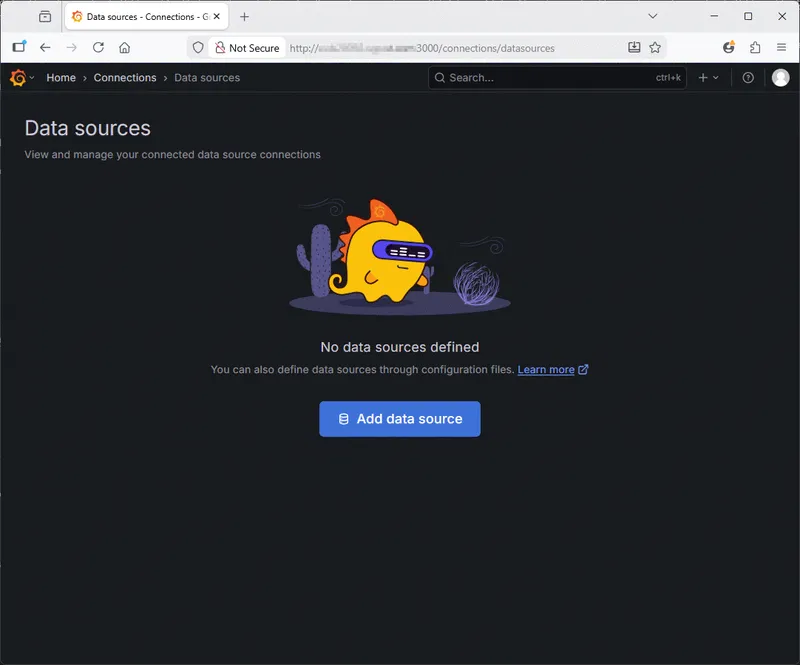
Go to http://localhost:3000 to access Grafana, change the admin password and configure the Prometheus data source (Connections / Data sources):
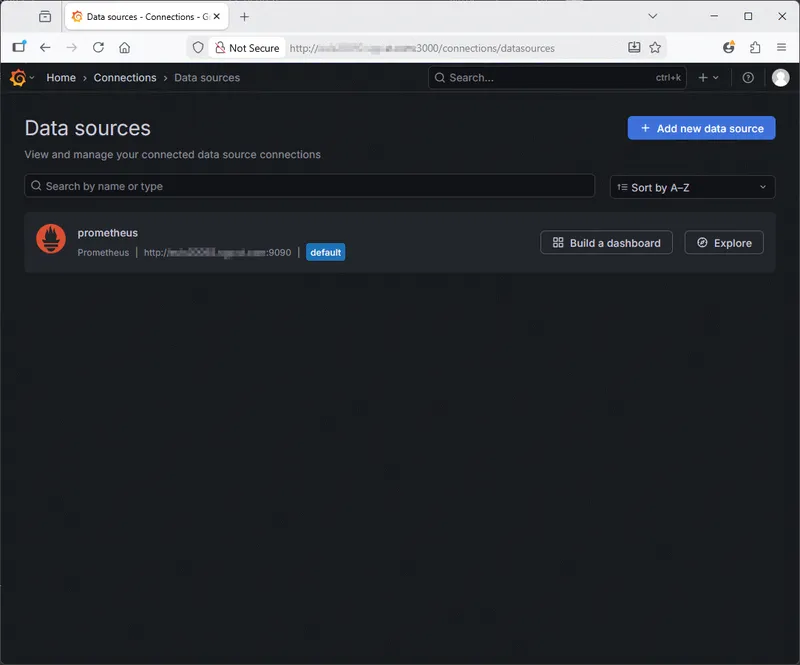
And choose Prometheus as Data Source:
For the official documentation I have uploaded the starter Grafana dashboard:
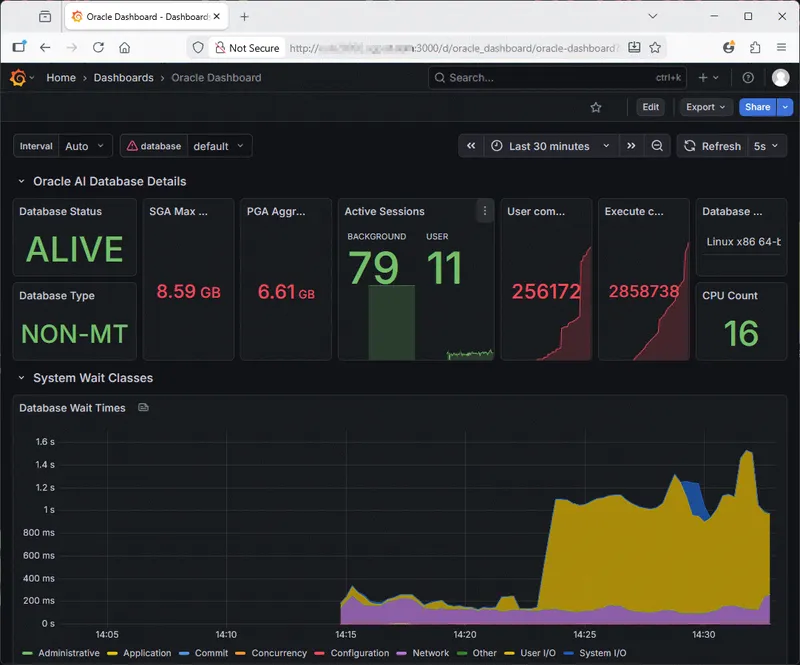
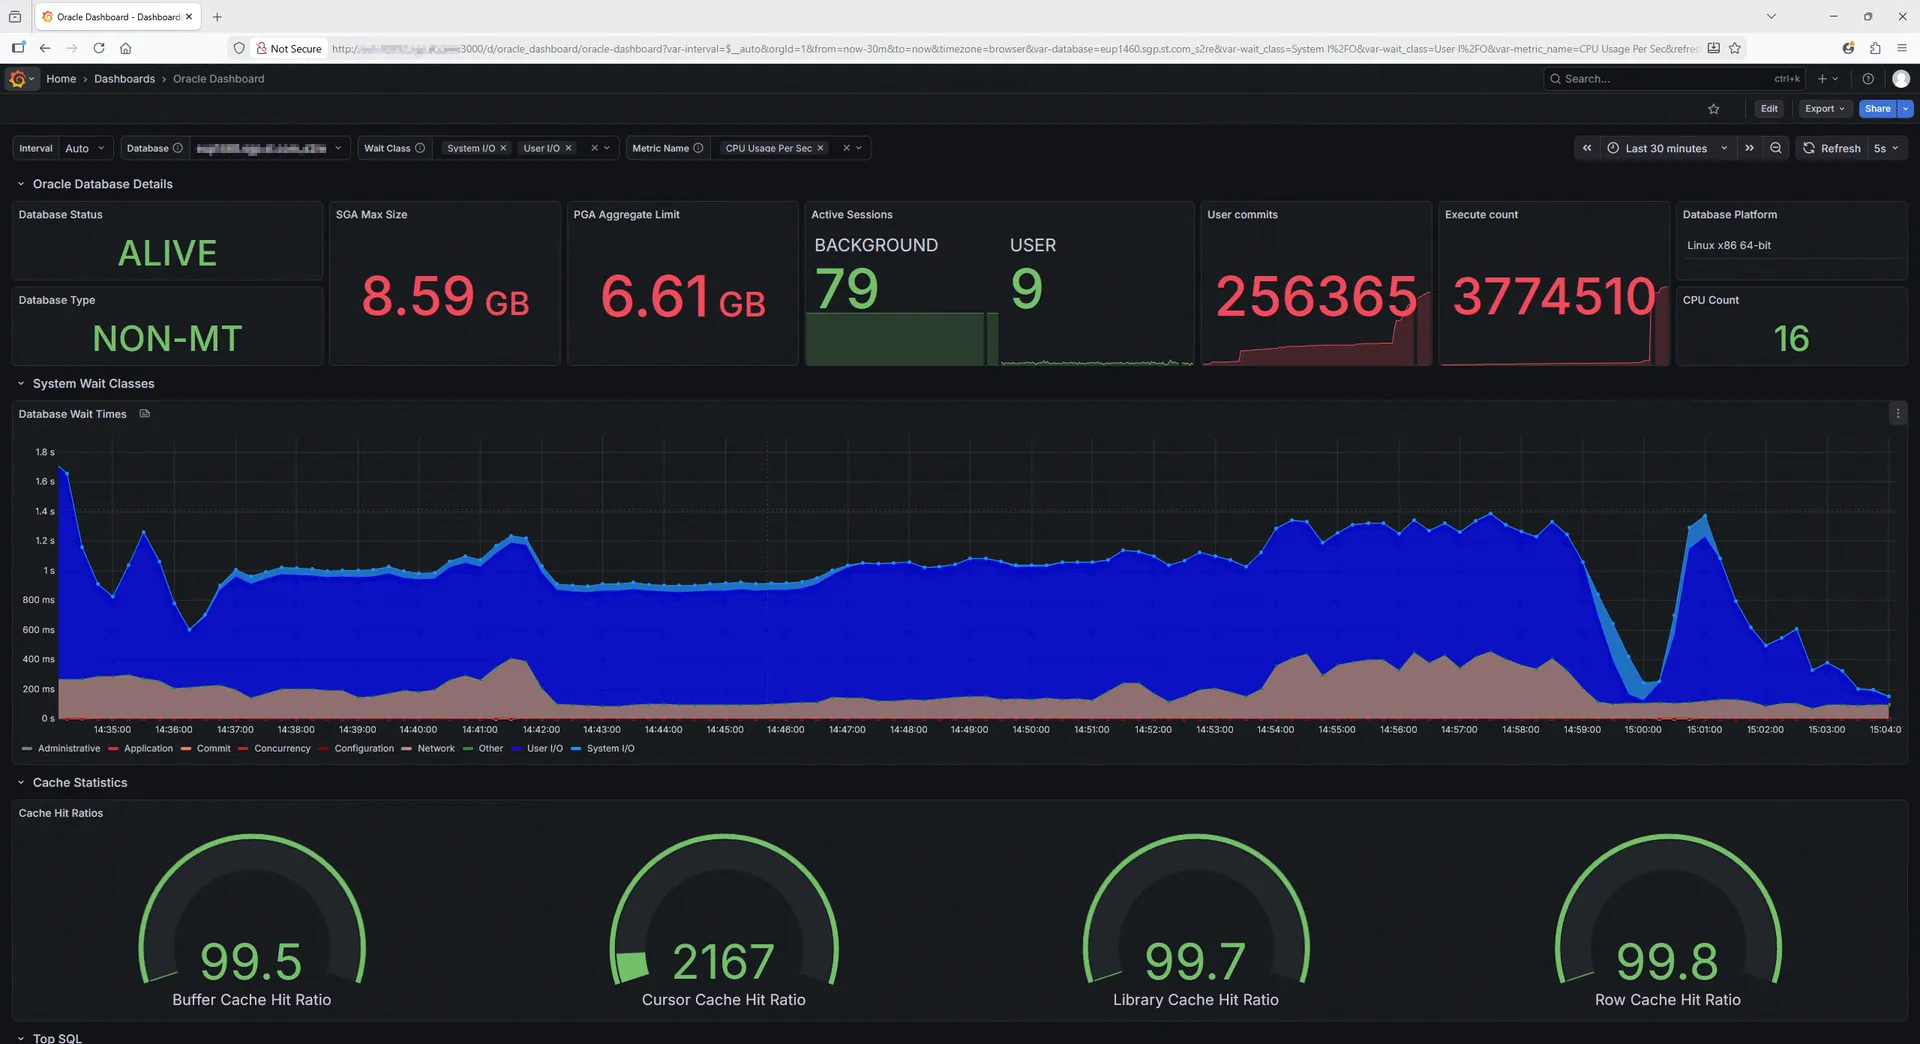
The first things I have done is configuraing the correct colors for the chart based on gv$system_wait_class and update the variable source from dashboard settings to remove the error:
Remark:
Used colors:
{
'CPU': '#32CD32',
'BCPU': '#3CB371',
'CPU Wait': '#9ACD32',
'Scheduler': '#90EE90',
'User I/O': '#0000FF',
'System I/O': '#1E90FF',
'Concurrency': '#B22222',
'Application': '#DC143C',
'Commit': '#FF7F50',
'Configuration': '#800000',
'Administrative': '#708090',
'Network': '#BC8F8F',
'Queueing': '#D2B48C',
'Cluster': '#F5DEB3',
'Other': '#FF69B4'
}
I have also added metrics collected by the Oracle Database Metrics Exporter but not added to the dashboard (few other still remains unused):
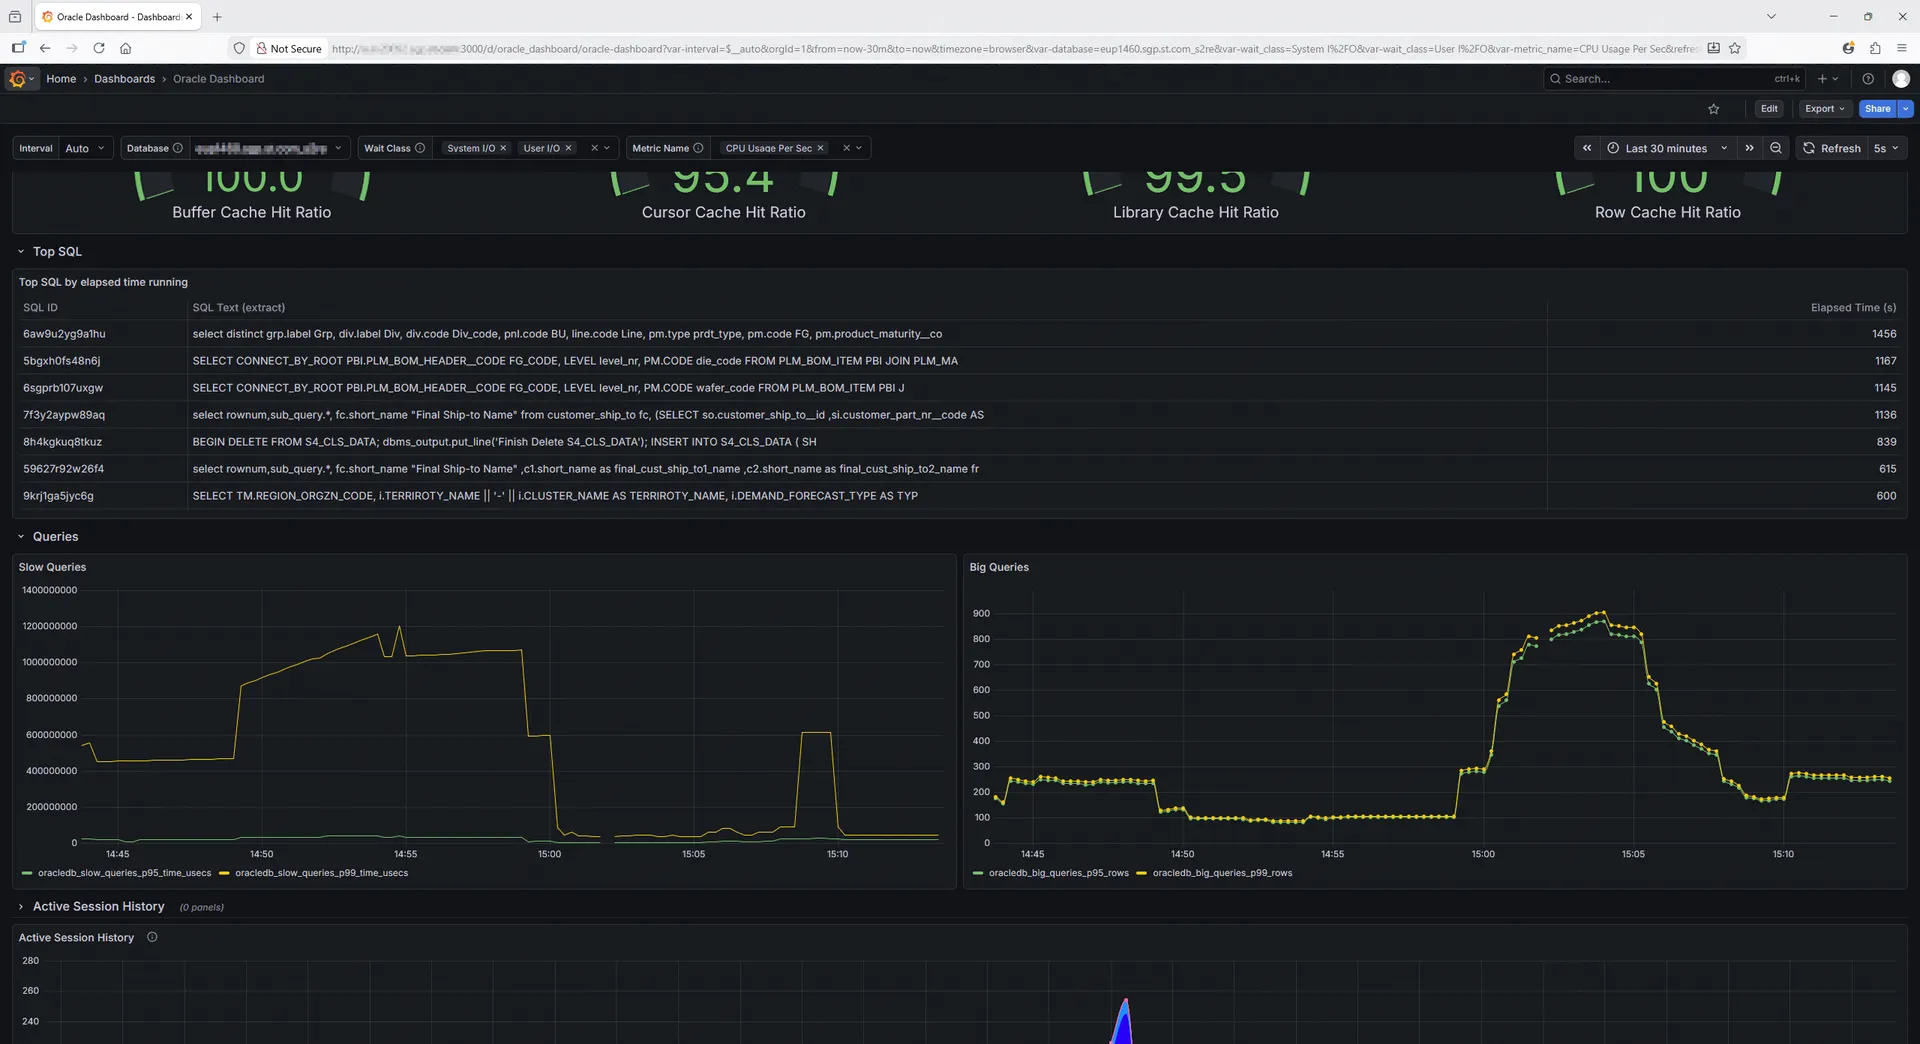
Oracle Database Metrics Exporter Metrics and visualization customization
The example above is a good starting point but I wanted to try a customization that opens the door to a no-limit usage of this. I was really exited with what I have done with Excel or Python but if I can club multiple database flavor in same dashboard tool then it would be very appealable…
What is also super easy with Prometheus is that you don’t have to bother to select a datetime column (like with Excel, Python or any Vue.js application) as Prometheus being a time series database all the burden of managing date and time is done automatically !!
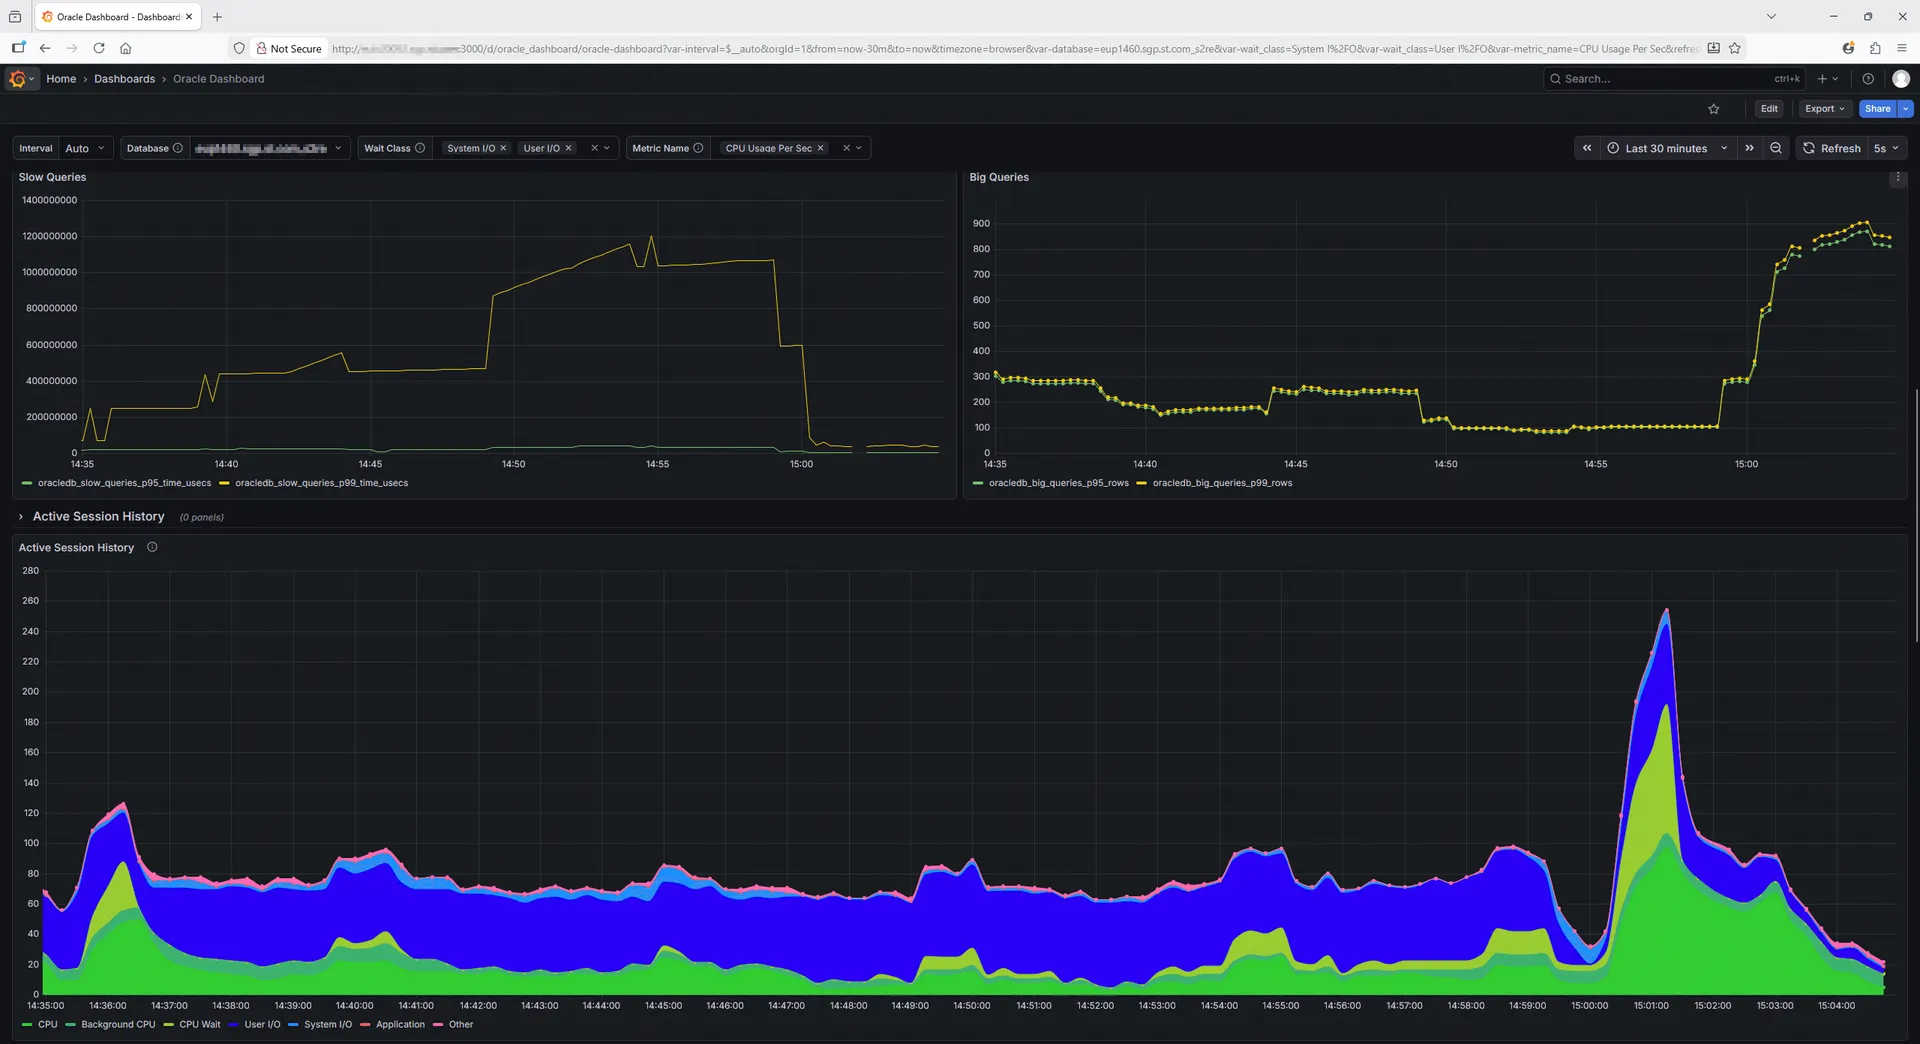
The first visualization I wanted to add is the typical one from Oracle Enterprise manager based on gv$active_session_history (Diagnostic and Tuning pack required). So added this to custom-metrics.toml file:
[[metric]]
context = "active_session_history"
labels = [ "inst_id", "wait_class", "con_id" ]
metricsdesc = { nb = "counter metric from gv$active_session_history and gv$sysmetric_history view in Oracle." }
metricstype = { nb = "counter" }
fieldtoappend= "wait_class"
request = '''
SELECT
inst_id,
DECODE(NVL(wait_class,'ON CPU'),'ON CPU',DECODE(session_type,'BACKGROUND','BCPU','CPU'),wait_class) AS wait_class,
COUNT(*) AS nb,
con_id
FROM gv$active_session_history
WHERE sample_time > SYSTIMESTAMP - INTERVAL '60' SECOND
GROUP BY
inst_id,
DECODE(NVL(wait_class,'ON CPU'),'ON CPU',DECODE(session_type,'BACKGROUND','BCPU','CPU'),wait_class),
con_id
UNION ALL
SELECT
inst_id,
'CPU_ORA_CONSUMED' AS wait_class,
value AS nb,
con_id
FROM gv$sysmetric_history
WHERE group_id=2
AND metric_name='CPU Usage Per Sec'
and end_time > SYSTIMESTAMP - INTERVAL '60' SECOND
ORDER BY wait_class
'''
ignorezeroresult = true
Remark
See my other article on CPU Wait where CPU Wait = CPU + BCPU – ‘CPU_ORA_CONSUMED’ if positive number unless 0.
Which gives:
Then I wanted to have the details of event per wait_class and be able with a dropdown to select the wait_class I want. So added in custom-metrics.toml file:
[[metric]]
context = "wait_class"
labels = [ "inst_id", "wait_class", "con_id" ]
metricsdesc = {value="List of non-idle wait class from gv$event_name"}
request = '''
select distinct inst_id, wait_class, con_id, 1 as value
from gv$event_name
where wait_class<>'Idle'
order by wait_class
'''

[[metric]]
context = "active_session_history_details"
labels = [ "inst_id", "wait_class", "event", "con_id" ]
metricsdesc = { nb = "counter metric from gv$active_session_history view in Oracle." }
metricstype = { nb = "counter" }
request = '''
SELECT
inst_id,
DECODE(NVL(wait_class,'ON CPU'),'ON CPU',DECODE(session_type,'BACKGROUND','BCPU','CPU'),wait_class) AS wait_class,
nvl(event,DECODE(session_type,'BACKGROUND','BCPU','CPU')) as event,
con_id,
COUNT(*) AS nb
FROM gv$active_session_history
WHERE sample_time > SYSTIMESTAMP - INTERVAL '60' SECOND
GROUP BY inst_id,
DECODE(NVL(wait_class,'ON CPU'),'ON CPU',DECODE(session_type,'BACKGROUND','BCPU','CPU'),wait_class),
nvl(event,DECODE(session_type,'BACKGROUND','BCPU','CPU')),
con_id
'''
ignorezeroresult = true
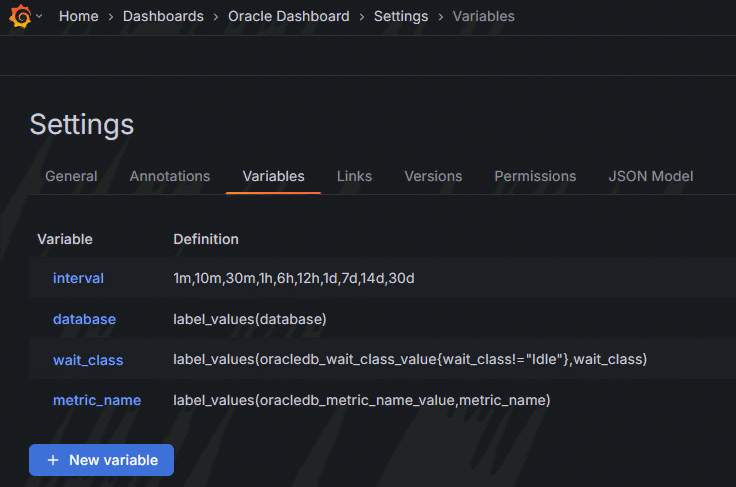
Created the new wait_class variable:
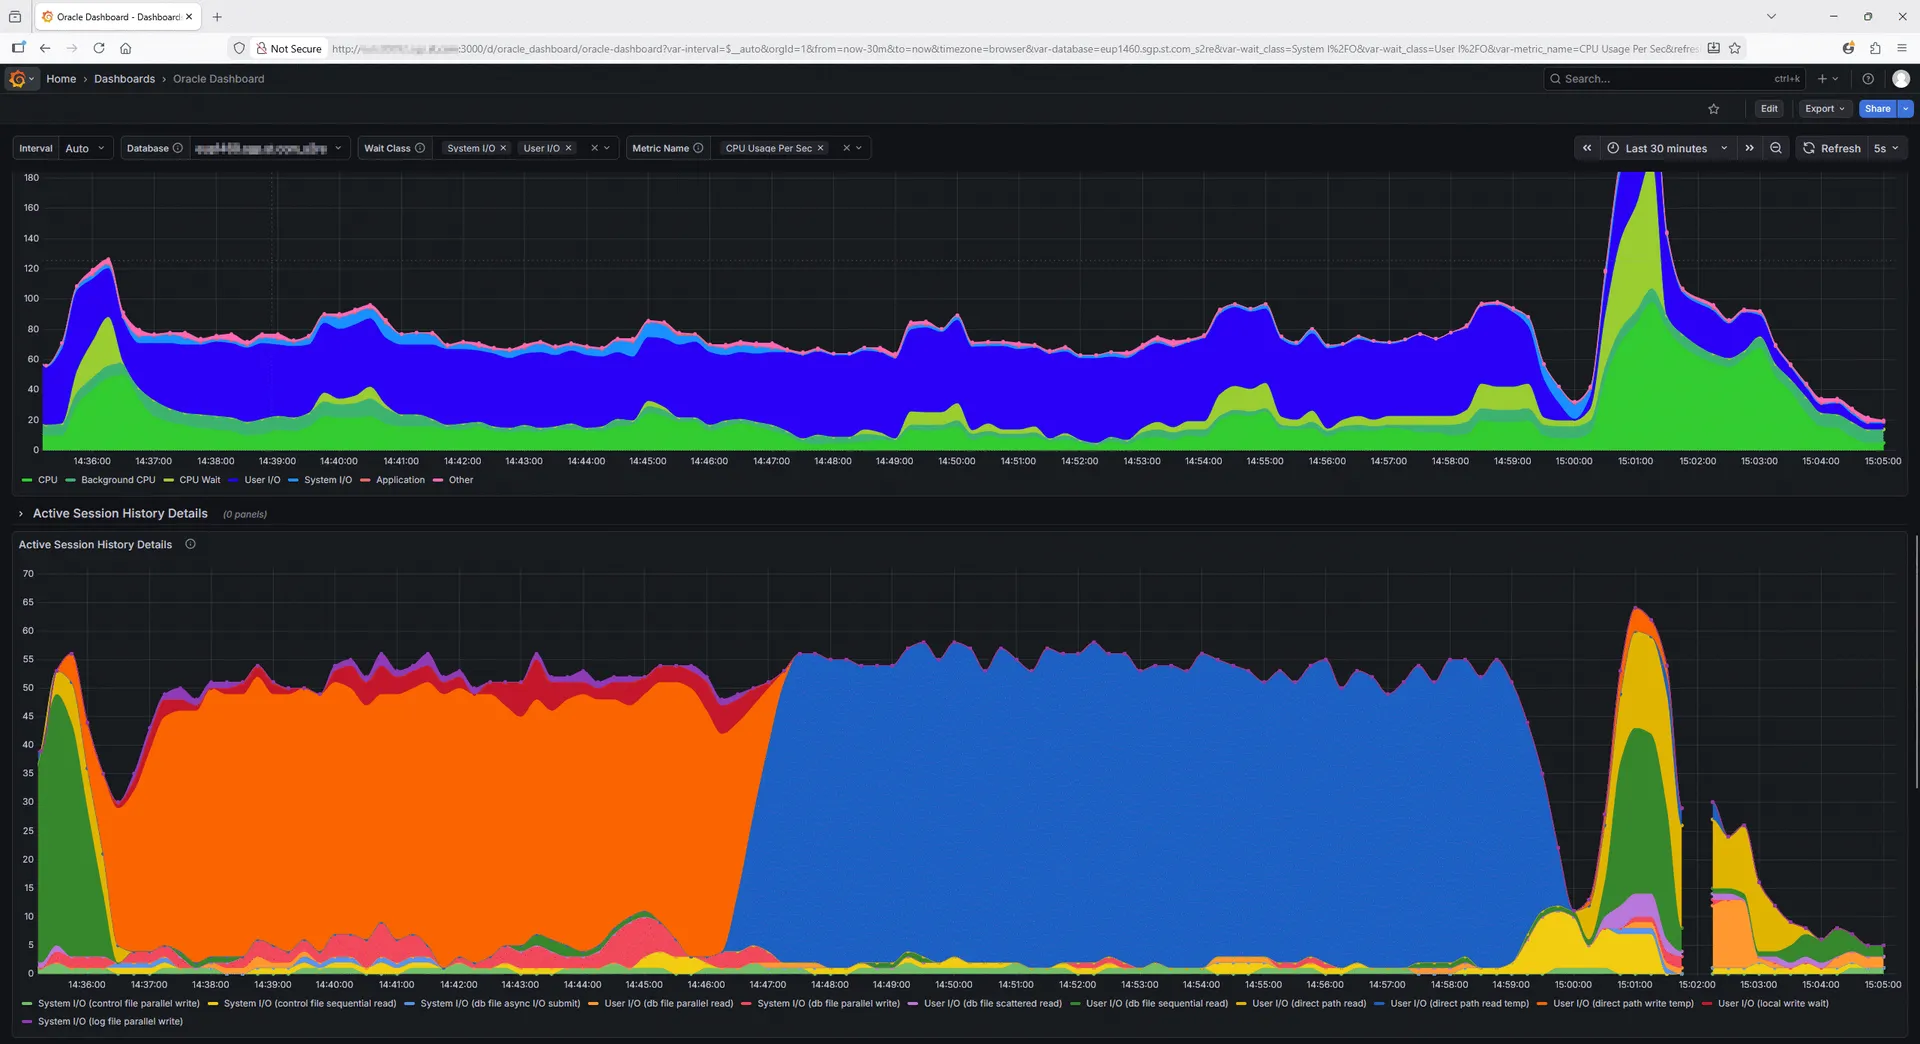
And I have now the event per wait class with the option in a dropdown to choose the wait class I wish:
On the same principle I added the different system metrics for the dropdown as well as the query to get the value (in custom-metrics.toml file):
[[metric]]
context = "metric_name"
labels = [ "inst_id", "metric_name", "con_id" ]
metricsdesc = {value="List of metric names gv$metricname"}
request = '''
select metric_name, 1 as value
from gv$metricname
where group_id=2
order by metric_name
'''

[[metric]]
context = "sysmetric"
labels = [ "metric_name" ]
metricsdesc = { value="counter for metric name" }
metricstype = { value = "counter" }
request = '''
SELECT
  metric_name,
  value
FROM gv$sysmetric
WHERE group_id=2
AND begin_time > SYSTIMESTAMP - INTERVAL '120' SECOND
order by metric_name
'''
ignorezeroresult = true
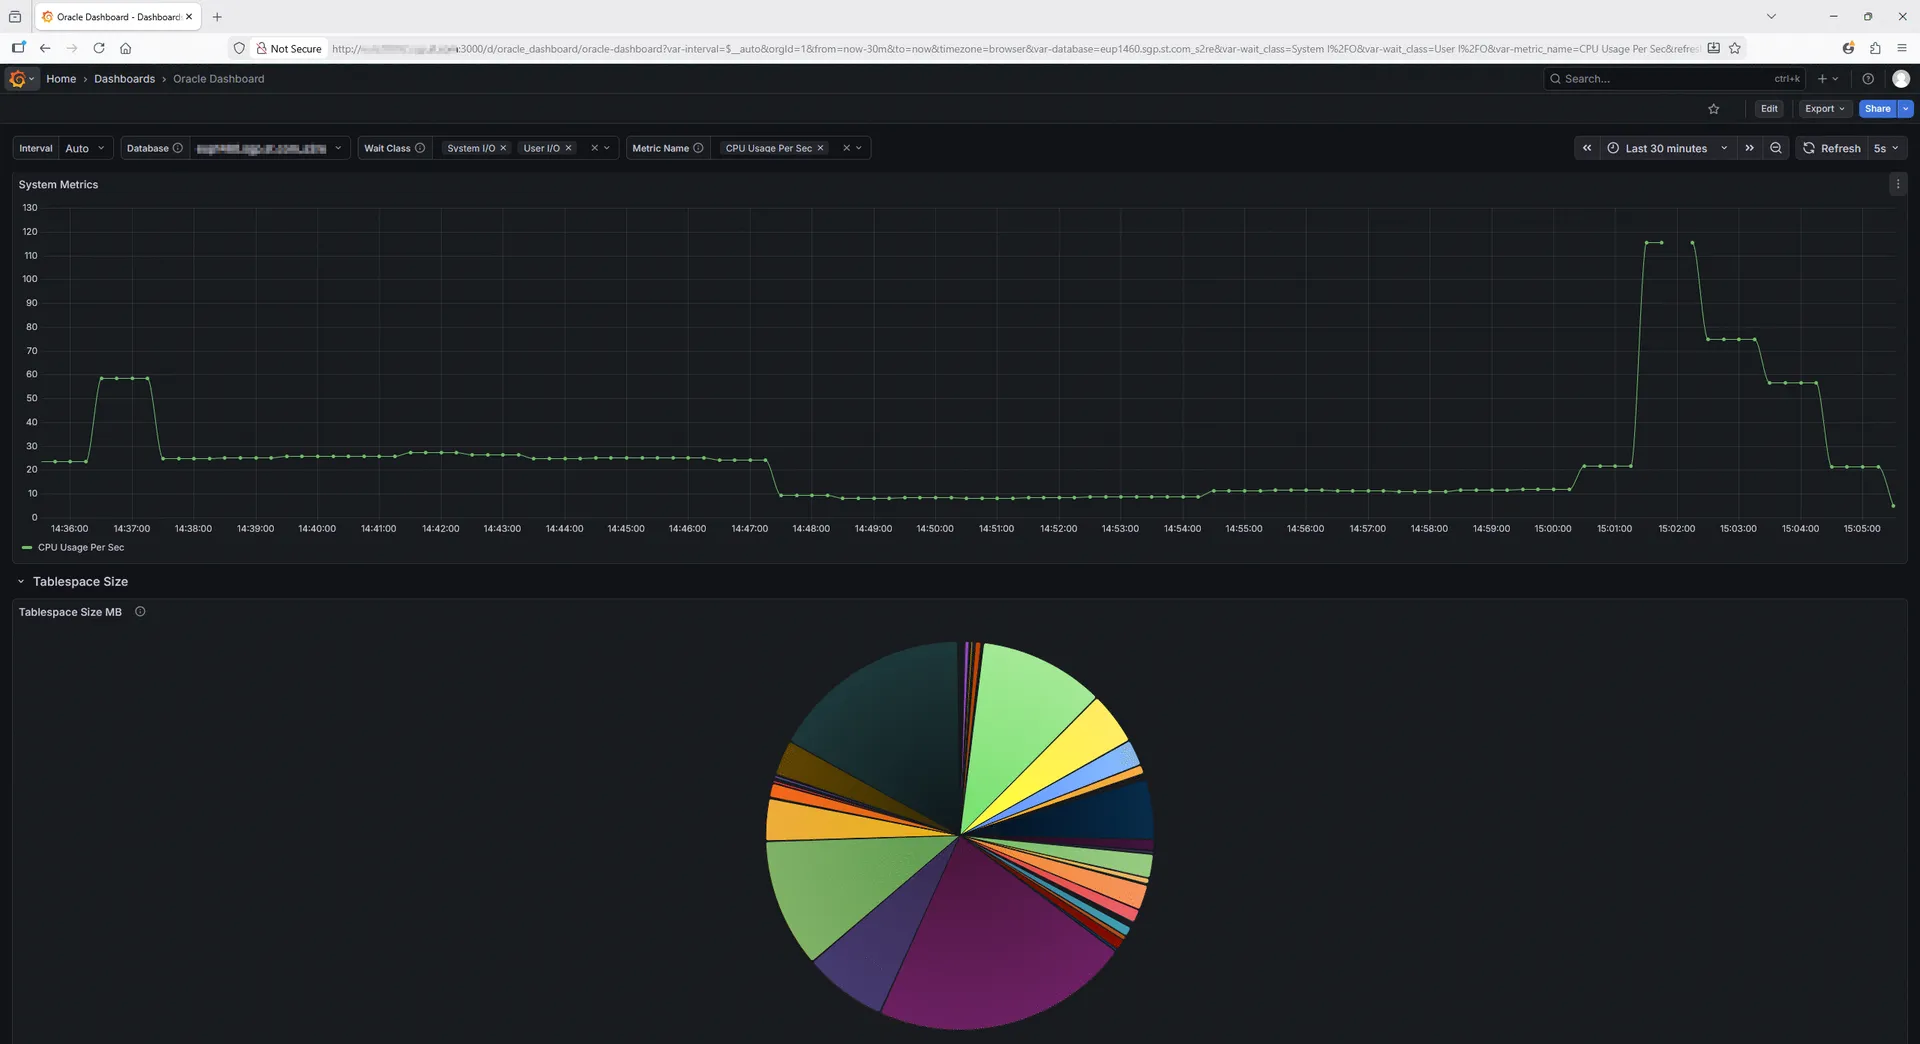
Which gives (the last chart on tablespace size is already in default collected metrics):
My oracle-dashboard can be downloaded from this link, as well as my custom-metrics.toml and updated default-metrics.toml.
About Post Author




Really like the custom metrics. Would you be interested in contributing these back to the oracledb exporter project so others with the diagnostic pack could use them?
Yes sure, tho not really sure I kept them, need to dig….