Our current MariaDB performance monitoring tool (for alerting we use Zabbix) licenses that is included in our support contract is going to vanish. MariaDB corporation has a new tool called MariaDB Remote Observability Service (ROS). I have been trying to install it but at the time of writing this blog post the product is honestly not so much mature and wanted to give a try to a potential alternative. So Prometheus and Grafana. I have already used extensively Grafana when working on our Hortonworks on premise Hadoop implementation and I fond in love for the product…
I am using a test server with Red Hat Enterprise Linux release 8.7 (Ootpa) and created a dedicated account to install Prometheus/Grafana/Node exporter/MariaDB exporter:
[prometheus@server01 ~]$ id
uid=51131(prometheus) gid=100(users) groups=100(users)
My test server has also a MariaDB instance running with it’s own dedicated account. The complete version list of my components is:
MariaDB database 10.11.4
Prometheus 2.45
Node exporter 1.6.0
MySQL/MariaDB exporter 0.15.0
Grafana 10.0.2
Prometheus installation
I have simply downloaded prometheus-2.45.0.linux-amd64.tar.gz Linux binary distribution and unzip it in a target directory with gtar xvf command. I have then followed the Getting started and created into my directory the below prometheus.yml file:
global:
scrape_interval: 15s # Set the scrape interval to every 15 seconds. Default is every 1 minute.
evaluation_interval: 15s # Evaluate rules every 15 seconds. The default is every 1 minute.# scrape_timeout is set to the global default (10s).# Alertmanager configuration
alerting:
alertmanagers:
- static_configs:
- targets:
# - alertmanager:9093# Load rules once and periodically evaluate them according to the global 'evaluation_interval'.
rule_files:
- 'prometheus.rules.yml'
# A scrape configuration containing exactly one endpoint to scrape:# Here it's Prometheus itself.
scrape_configs:
# The job name is added as a label `job=<job_name>` to any timeseries scraped from this config.
- job_name: "prometheus"
scrape_interval: 5s
static_configs:
- targets: ["server01.domain.com:9090"]
global:
scrape_interval: 15s # Set the scrape interval to every 15 seconds. Default is every 1 minute.
evaluation_interval: 15s # Evaluate rules every 15 seconds. The default is every 1 minute.
# scrape_timeout is set to the global default (10s).# Alertmanager configuration
alerting:
alertmanagers:
- static_configs:
- targets:
# - alertmanager:9093# Load rules once and periodically evaluate them according to the global 'evaluation_interval'.
rule_files:
- 'prometheus.rules.yml'# A scrape configuration containing exactly one endpoint to scrape:
# Here it's Prometheus itself.
scrape_configs:
# The job name is added as a label `job=<job_name>` to any timeseries scraped from this config.
- job_name: "prometheus"
scrape_interval: 5s
static_configs:
- targets: ["server01.domain.com:9090"]
If you go on http://server01.domain.com:9090 from your laptop browser you should see the Prometheus home page.
Prometheus node exporter installation
Prometheus is working with exporter and the first one I have installed is node exporter to get metrics for my test node. That is executing Prometheus as well as my MariaDB test instance. The node exporter is provided by default by Prometheus official community.
Node exporter is officially provided by Prometheus and can be downloaded from https://prometheus.io/download/. Unzip it in a target directory. I have simply execute it with default value so pull port of node exporter is 9100 (use -h parameter to see complete list of possible customization). Then I executed it with:
Remark: The labels under each job_name section is a good trick to have a human display of your target. Node_name added label is just to add a better display and to have a new variable (node_name), used in a drop down list on dashboards, with a human readable value without node exporter port… This is also useful in Percona dashboards as they use it.
Restart Prometheus with kill -s SIGHUP spid.
Prometheus MySQL/MariaDB exporter installation
To extract figures from my MariaDB instance you must create a database user with quite high privileges (versus official MySQL/MariaDB exporter documentation I had to grant slave monitor on top):
create user 'exporter'@'%' identified by password 'secure_password' with max_user_connections 3;
grant select, process, binlog monitor, slave monitor on *.* to 'exporter'@'%';
Extract the binaries and to put your MariaDB credentials in a configuration file:
To customize extracted metrics I have created below startup script (issue ./mysqld_exporter -h to have a complete list of all the options, the default values are not nicely displayed like with node exporter):
Remark: Added label service_name is as well a good way of remembering the server name and the listening port of my MariaDB instance. This is also a mandatory variable if you plan to use the Percona Grafan dashboard as is as we will see later on.
Going to http://server01.domain.com:9090/target you should see something like:
prometheus01
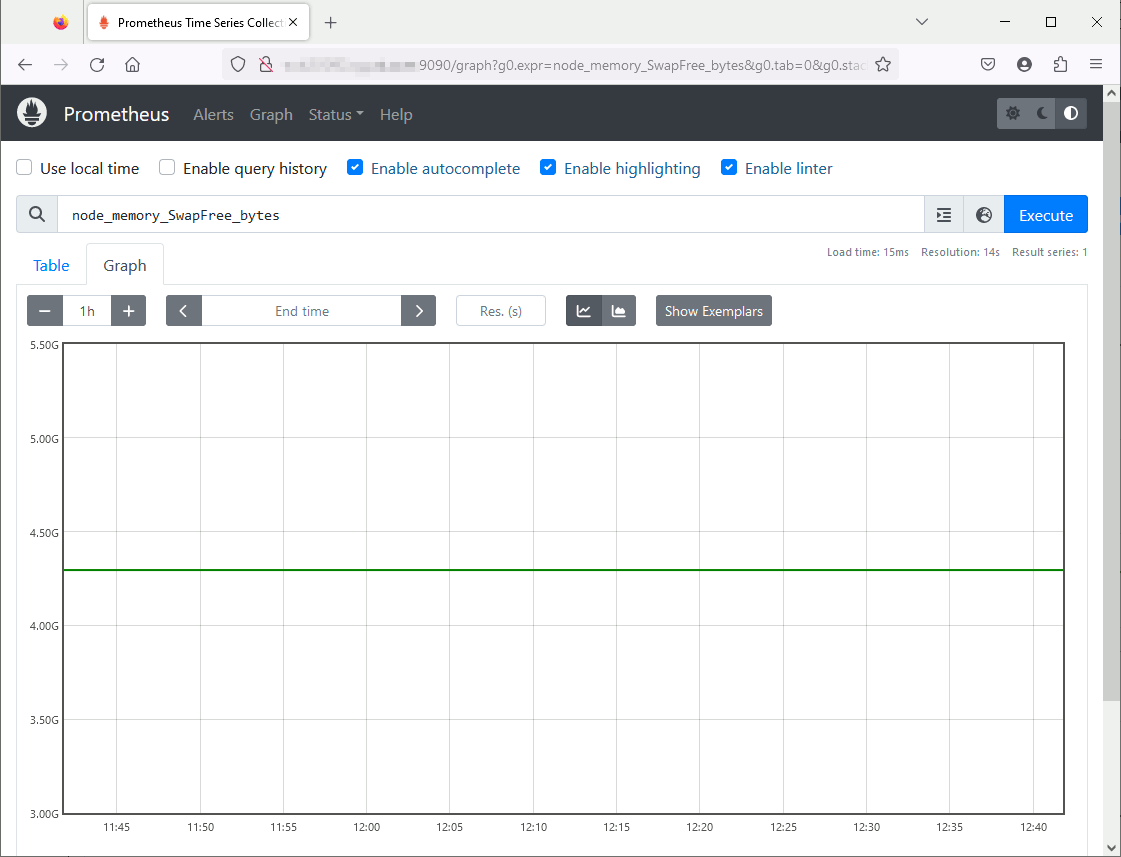
Prometheus has basic display and graph capabilities, go to http://server01.domain.com:9090/graph and choose second panel in bottom pat of the screen. Choose a random metric, I have chosen node_memory_SwapFree_bytes from node exported that gives me swap free size. And you can graph it:
prometheus02
Grafana installation
I have download binary Enterprise distribution (grafana-enterprise-10.0.2.linux-amd64.tar.gz) and extracted it to default directory. Then simply executed, with no configuration:
[prometheus@server01 grafana-10.0.2]$ nohup ./bin/grafana server &
[prometheus@server01 grafana-10.0.2]$ nohup ./bin/grafana server &
Then you can access to http://server01.domain.com:3000 and default account is admin/admin. You will have to change password at first login.
The first thing to do is to configure Prometheus as a datasource (Home /Connections) and add a connection of type Prometheus. There is not much to fill in except the Prometheus server name and port (http://server01.domain.com:9090/ for me) and its version and type:
prometheus03
Grafana configuration
To build dashboards using Prometheus metrics you have the option to start on your own, or better, import some already built dashboard. You can find plenty of quality ones at:
For the Percona dashboard you will need the service_variable that I have suggested to add in Prometheus configuration as well as few Grafana plugins. To install Grafana plugins simply do (the htts_proxy variable has to be set only if, like me, you are behind a corporate Proxy):
[prometheus@server01 ~]$ exporthttps_proxy='http://proxy_account:proxy_password@proxy_server:proxy_port'[prometheus@server01 ~]$ ~/grafana-10.0.2/bin/grafana cli plugins list-remote
.
.
[prometheus@server01 ~]$ ~/grafana-10.0.2/bin/grafana cli --pluginsDir ~/grafana-10.0.2/data/plugins plugins install yesoreyeram-boomtable-panel
✔ Downloaded and extracted yesoreyeram-boomtable-panel v1.4.1 zip successfully to /home/prometheus/grafana-10.0.2/data/plugins/yesoreyeram-boomtable-panel
Please restart Grafana after installing or removing plugins. Refer to Grafana documentation for instructions if necessary.
[prometheus@server01 ~]$ ~/grafana-10.0.2/bin/grafana cli --pluginsDir ~/grafana-10.0.2/data/plugins plugins install percona-percona-app
✔ Downloaded and extracted percona-percona-app v1.0.1 zip successfully to /home/prometheus/grafana-10.0.2/data/plugins/percona-percona-app
Please restart Grafana after installing or removing plugins. Refer to Grafana documentation for instructions if necessary.
[prometheus@server01 ~]$ export https_proxy='http://proxy_account:proxy_password@proxy_server:proxy_port'
[prometheus@server01 ~]$ ~/grafana-10.0.2/bin/grafana cli plugins list-remote
.
.
[prometheus@server01 ~]$ ~/grafana-10.0.2/bin/grafana cli --pluginsDir ~/grafana-10.0.2/data/plugins plugins install yesoreyeram-boomtable-panel
✔ Downloaded and extracted yesoreyeram-boomtable-panel v1.4.1 zip successfully to /home/prometheus/grafana-10.0.2/data/plugins/yesoreyeram-boomtable-panelPlease restart Grafana after installing or removing plugins. Refer to Grafana documentation for instructions if necessary.[prometheus@server01 ~]$ ~/grafana-10.0.2/bin/grafana cli --pluginsDir ~/grafana-10.0.2/data/plugins plugins install percona-percona-app
✔ Downloaded and extracted percona-percona-app v1.0.1 zip successfully to /home/prometheus/grafana-10.0.2/data/plugins/percona-percona-appPlease restart Grafana after installing or removing plugins. Refer to Grafana documentation for instructions if necessary.
Remark: The default Grafana plugin directory is under data/plugins but it can be changed in Grafana configuration file. Restart Grafana daemon with kill -s SIGHUP after plugins installation.
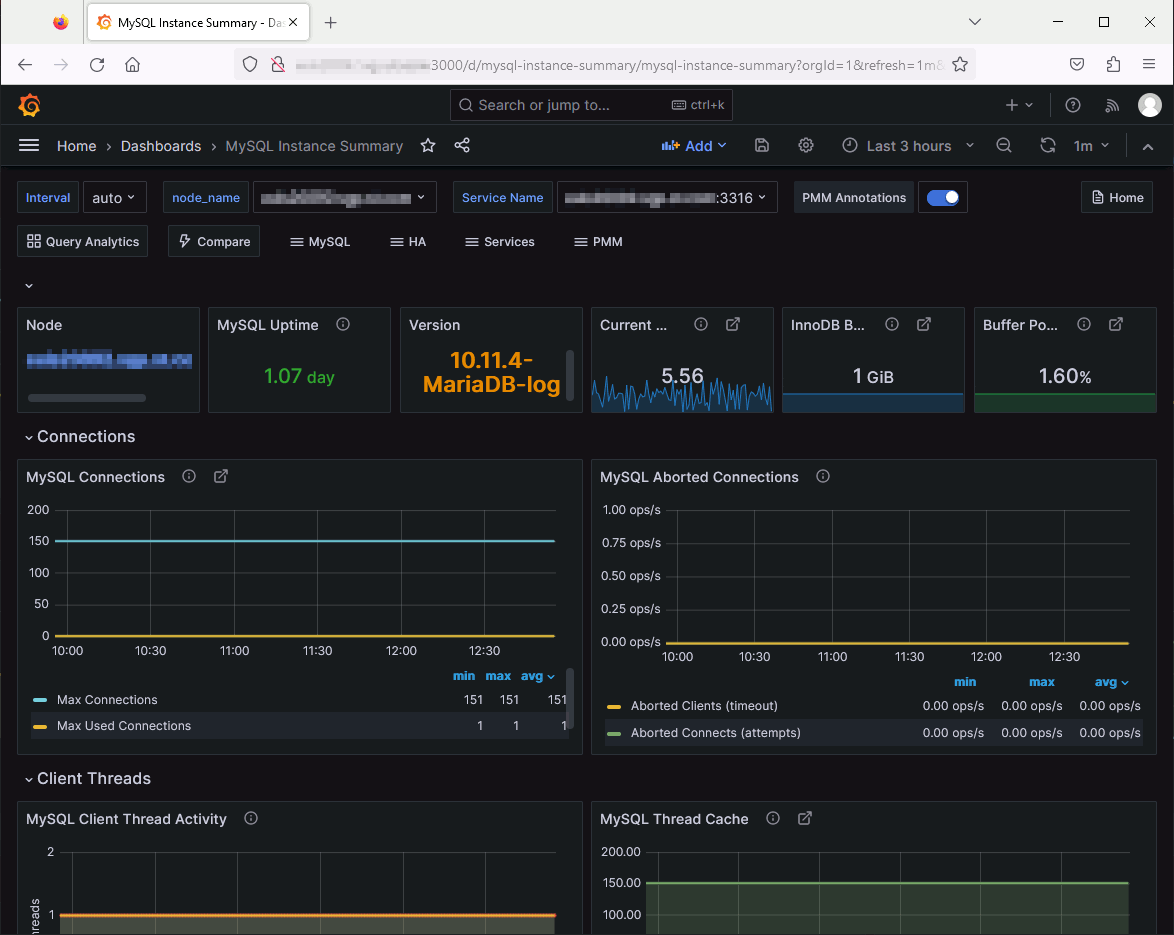
MySQL instance summary dashboard. For this one I had to modify it a bit but exporting the correct labels in your Prometheus configuration helps a lot. To extract only a part of a variables you have to use Grafana regex (https://grafana.com/docs/grafana/latest/dashboards/variables/add-template-variables/#filter-and-modify-using-named-text-and-value-capture-groups):
prometheus06
Conclusion
This is at same time super easy to setup and really impressive in performance indicators you can display ! If you want to skip the configuration part you can go for Percona Monitoring and Management Tool (PMM) but what I don’t really like is their server part that is only available through a container (and instead of pull mode you will have an agent to install). Where I work we have decided to use Zabbix but I cannot judge on the push/pull debate amongst monitoring tools.
Discussing with my monitoring tools expert teammate I told him that I do not like too much the look and feel of Zabbix graphs versus the one of Grafana that are really beautiful and limitless. But he claimed that Zabbix can also be interfaced with Grafana and be a source. So apparently Zabbix is more to be put in front of Prometheus.