Table of contents
Preamble
Since we have migrated in HFP 3 we had recurring issue with HiveServer2 memory (Ambari memory alert) or the process simply got stuck. When trying to monitor memory consumption we discovered that with HDP 3.x the Ambari Metrics for HiveServer2 heap usage are not displayed anymore in Grafana (No datapoints):

I have tried to correct the chart in Grafana when logged (admin account) but even if the metrics are listed there is nothing to display:

We got advised to use Java Management Extensions (JMX) Technology to monitor and manage this HiveServer2 Java process using jconsole. Using jconsole would also allow us to issue on-demand a garbage collector task.
Last but not least I have finally found an article on how to restore the HiveServer2 metrics in Grafana…
We are running Hortonworks Data Platform (HDP) 3.1.4 so hive 3.1.0 and Ambari 2.7.4.
Hiveserver2 monitoring with Jconsole
As it is clearly described in Java official documentation to activate JMX for your Java process you simply need to add below option when executing your process:
-Dcom.sun.management.jmxremote |
Adding only this parameter will allow local monitoring i.e. the jconsole must be launched on the server where is running your Java process.
The Cloudera documentation has (as usual) quite a few typo issues and what you need to modify is HADOOP_OPTS environment variable. This is done in Ambari for Hiveserver2 in Hive services and hive-env template parameter. I have chosen to re-export the variable keeping its previous value not to change the default Ambari setting:
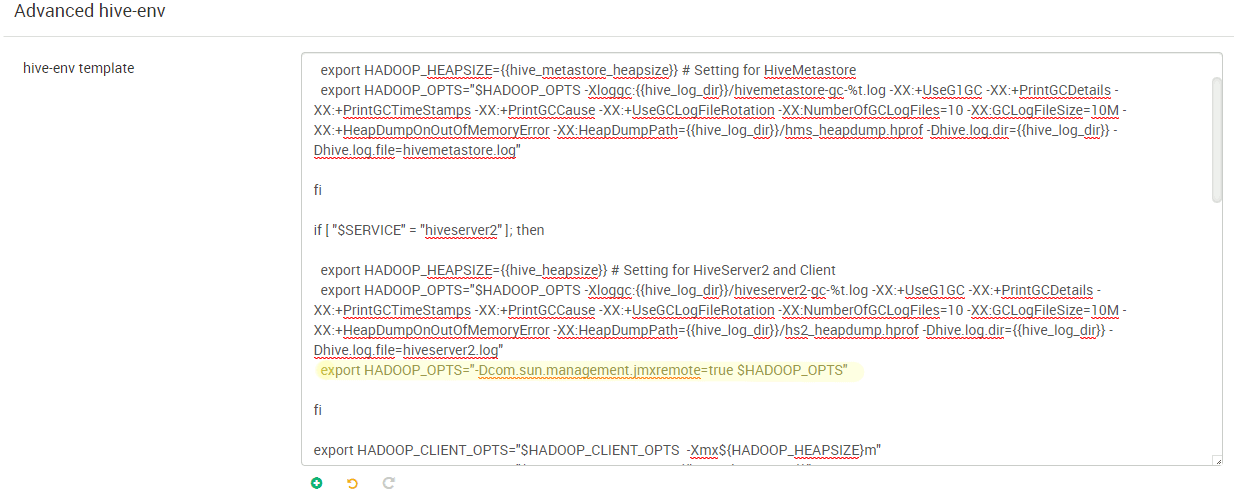
So I added:
export HADOOP_OPTS="-Dcom.sun.management.jmxremote=true $HADOOP_OPTS" |
You can find your Hiveserver2 process pid using:
[root@hive_server ~]# ps -ef | grep java |grep hiveserver2 hive 9645 1 0 09:55 ? 00:01:14 /usr/jdk64/jdk1.8.0_112/bin/java -Dproc_jar -Dhdp.version=3.1.4.0-315 -Djava.net.preferIPv4Stack=true -Dcom.sun.management.jmxremote=true -Dcom.sun.management.jmxremote.ssl=false -Dcom.sun.management.jmxremote.authenticate=false -Dcom.sun.management.jmxremote.port=8004 -Xloggc:/var/log/hive/hiveserver2-gc-%t.log -XX:+UseG1GC -XX:+PrintGCDetails -XX:+PrintGCTimeStamps -XX:+PrintGCCause -XX:+UseGCLogFileRotation -XX:NumberOfGCLogFiles=10 -XX:GCLogFileSize=10M -XX:+HeapDumpOnOutOfMemoryError -XX:HeapDumpPath=/var/log/hive/hs2_heapdump.hprof -Dhive.log.dir=/var/log/hive -Dhive.log.file=hiveserver2.log -Dhdp.version=3.1.4.0-315 -Xmx8192m -Dproc_hiveserver2 -Xmx48284m -Dlog4j.configurationFile=hive-log4j2.properties -Djava.util.logging.config.file=/usr/hdp/current/hive-server2/conf//parquet-logging.properties -Dyarn.log.dir=/var/log/hadoop/hive -Dyarn.log.file=hadoop.log -Dyarn.home.dir=/usr/hdp/3.1.4.0-315/hadoop-yarn -Dyarn.root.logger=INFO,console -Djava.library.path=:/usr/hdp/current/hadoop-client/lib/native/Linux-amd64-64:/usr/hdp/3.1.4.0-315/hadoop/lib/native/Linux-amd64-64:/usr/hdp/current/hadoop-client/lib/native -Dhadoop.log.dir=/var/log/hadoop/hive -Dhadoop.log.file=hadoop.log -Dhadoop.home.dir=/usr/hdp/current/hadoop-client -Dhadoop.id.str=hive -Dhadoop.root.logger=INFO,console -Dhadoop.policy.file=hadoop-policy.xml -Dhadoop.security.logger=INFO,NullAppender org.apache.hadoop.util.RunJar /usr/hdp/3.1.4.0-315/hive/lib/hive-service-3.1.0.3.1.4.0-315.jar org.apache.hive.service.server.HiveServer2 --hiveconf hive.aux.jars.path=file:///usr/hdp/current/hive-webhcat/share/hcatalog/hive-hcatalog-core.jar hive 18276 1 0 10:02 ? 00:00:49 /usr/jdk64/jdk1.8.0_112/bin/java -Dproc_jar -Dhdp.version=3.1.4.0-315 -Djava.net.preferIPv4Stack=true -Xloggc:/var/log/hive/hiveserverinteractive-gc-%t.log -XX:+UseG1GC -XX:+PrintGCDetails -XX:+PrintGCTimeStamps -XX:+PrintGCCause -XX:+UseGCLogFileRotation -XX:NumberOfGCLogFiles=10 -XX:GCLogFileSize=10M -XX:+HeapDumpOnOutOfMemoryError -XX:HeapDumpPath=/var/log/hive/hsi_heapdump.hprof -Dhive.log.dir=/var/log/hive -Dhive.log.file=hiveserver2Interactive.log -Dhdp.version=3.1.4.0-315 -Xmx8192m -Dproc_hiveserver2 -Xmx2048m -Dlog4j.configurationFile=hive-log4j2.properties -Djava.util.logging.config.file=/usr/hdp/current/hive-server2/conf_llap//parquet-logging.properties -Dyarn.log.dir=/var/log/hadoop/hive -Dyarn.log.file=hadoop.log -Dyarn.home.dir=/usr/hdp/3.1.4.0-315/hadoop-yarn -Dyarn.root.logger=INFO,console -Djava.library.path=:/usr/hdp/current/hadoop-client/lib/native/Linux-amd64-64:/usr/hdp/3.1.4.0-315/hadoop/lib/native/Linux-amd64-64:/usr/hdp/current/hadoop-client/lib/native -Dhadoop.log.dir=/var/log/hadoop/hive -Dhadoop.log.file=hadoop.log -Dhadoop.home.dir=/usr/hdp/current/hadoop-client -Dhadoop.id.str=hive -Dhadoop.root.logger=INFO,console -Dhadoop.policy.file=hadoop-policy.xml -Dhadoop.security.logger=INFO,NullAppender org.apache.hadoop.util.RunJar /usr/hdp/3.1.4.0-315/hive/lib/hive-service-3.1.0.3.1.4.0-315.jar org.apache.hive.service.server.HiveServer2 --hiveconf hive.aux.jars.path=file:///usr/hdp/current/hive-server2/lib/hive-hcatalog-core.jar |
Then run jconsole command from your $JDK_HOME/bin directory. You run it from $JDK_HOME/bin directory and you obviously need to set the DISPLAY environment variable and have a X server running on your desktop (MobaXterm strongly recommended):

Click on Connect and acknowledge the SSL warning, you can now start monitoring:
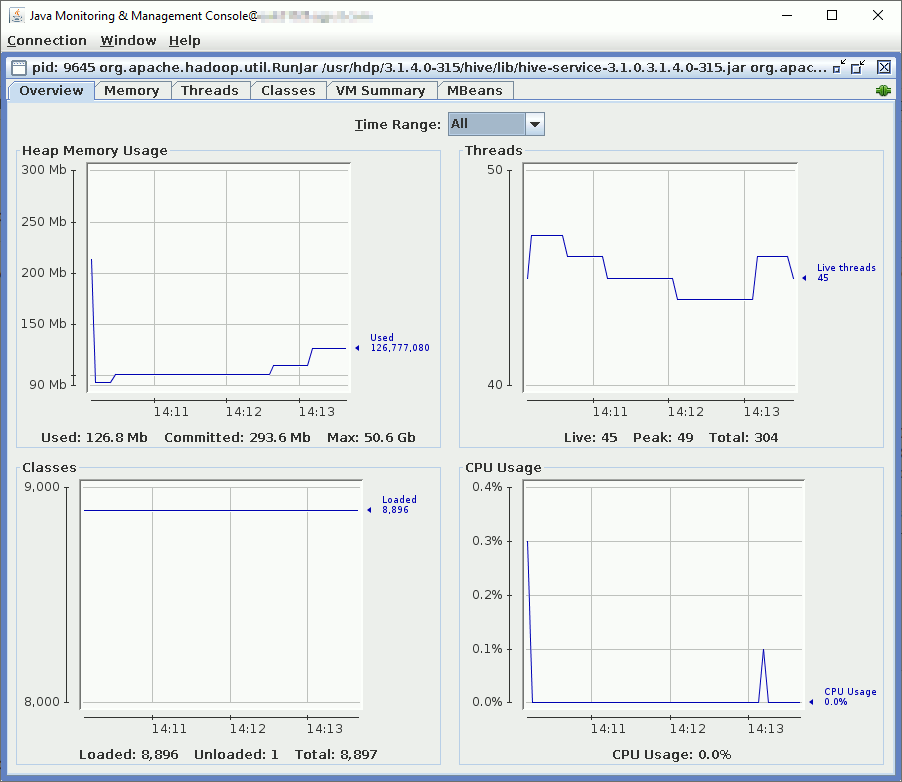
Or perform a garbage collector if you think you have a non-expected memory issue with the process:
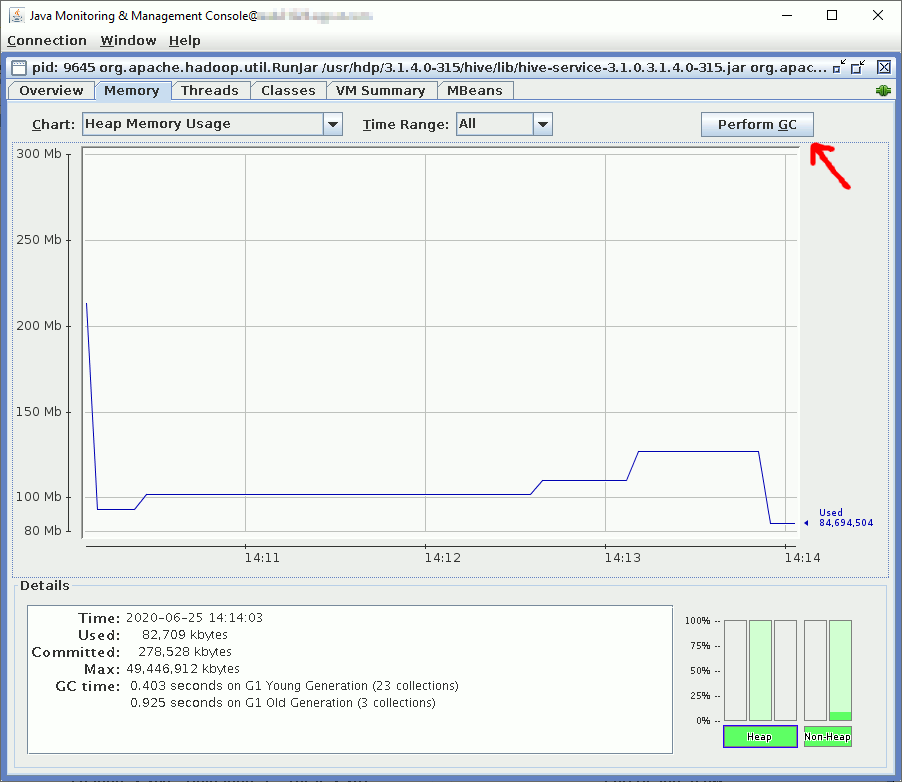
If you want to be able to remotely monitor you need to add com.sun.management.jmxremote.port=portnum parameter.
To disable SSL if you do not have a certificate use com.sun.management.jmxremote.ssl=false.
Then comes authentication, you can:
- De-activate it with com.sun.management.jmxremote.authenticate=false (not recommended but simplest way to remotely connect)
- Use LDAP authentication with com.sun.management.jmxremote.login.config=ExampleCompanyConfig and java.security.auth.login.config=ldap.config
- Use a file base authentication using com.sun.management.jmxremote.password.file=pwFilePath
To, at least, activate file base authentication get the password file template from $JDK_HOME/jre/lib/management/jmxremote.password.template file and put it in /usr/hdp/current/hive-server2/conf/. Rename it to jmxremote.password and create the users (role in fact according to official documentation):
[root@hive_server ~]# tail /usr/hdp/current/hive-server2/conf/jmxremote.password # For # security, you should either restrict the access to this file, # or specify another, less accessible file in the management config file # as described above. # # Following are two commented-out entries. The "measureRole" role has # password "QED". The "controlRole" role has password "R&D". # # monitorRole QED # controlRole R&D yjaquier secure_password |
Also modify $JDK_HOME//jre/lib/management/jmxremote.access to reflect your newly create role/user. Here I have just chosen to inherit highest privilege role:
[root@hive_server jdk1.8.0_112]# tail $JDK_HOME/jre/lib/management/jmxremote.access # o The "controlRole" role has readwrite access and can create the standard # Timer and Monitor MBeans defined by the JMX API. monitorRole readonly controlRole readwrite \ create javax.management.monitor.*,javax.management.timer.* \ unregister yjaquier readwrite \ create javax.management.monitor.*,javax.management.timer.* \ unregister |
My HADOOP_OPTS variable is now:
export HADOOP_OPTS="-Dcom.sun.management.jmxremote=true -Dcom.sun.management.jmxremote.ssl=false -Dcom.sun.management.jmxremote.password.file=$HIVE_CONF_DIR/jmxremote.password -Dcom.sun.management.jmxremote.port=8004 $HADOOP_OPTS" |
If HiveServer2 is not restarting you will most probably find in error log something like:
[root@hive_server hive]# cat hive-server2.err Error: Password file read access must be restricted: /usr/hdp/current/hive-server2/conf//jmxremote.password Error: Password file read access must be restricted: /usr/hdp/current/hive-server2/conf//jmxremote.password |
Easy to solve with:
[root@hive_server conf]# chmod 600 jmxremote.password [root@hive_server conf]# ll jmxremote.password -rw------- 1 hive hadoop 2880 Jun 25 14:32 jmxremote.password |
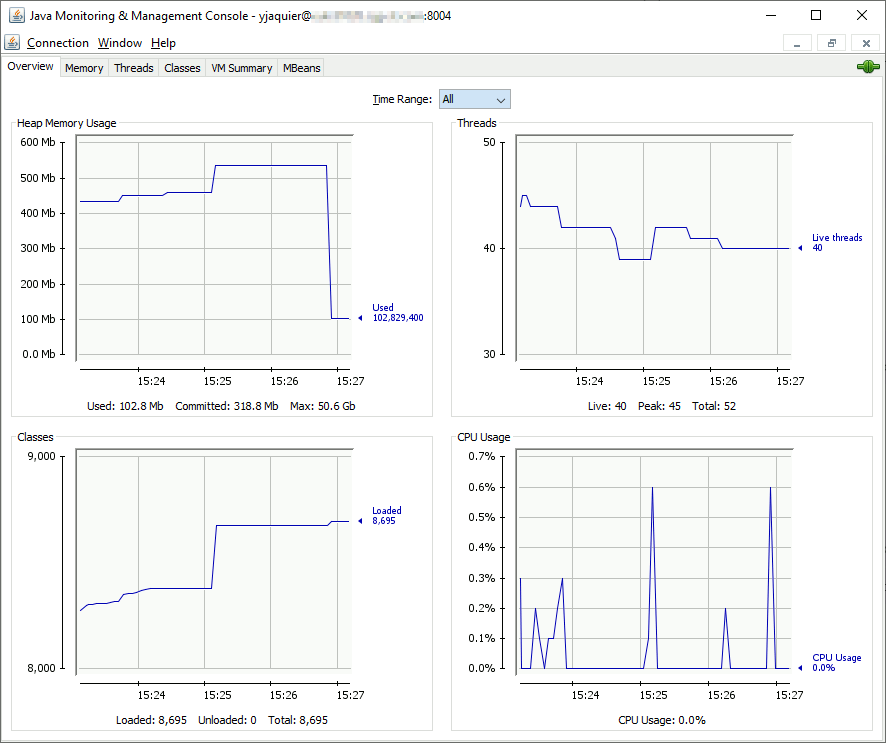
And with my local jconsole program (C:\Program Files\Java\jdk1.8.0_241\bin for me) of my desktop JDK installation I can remotely connect (also notice the better visual quality with Windows edition):
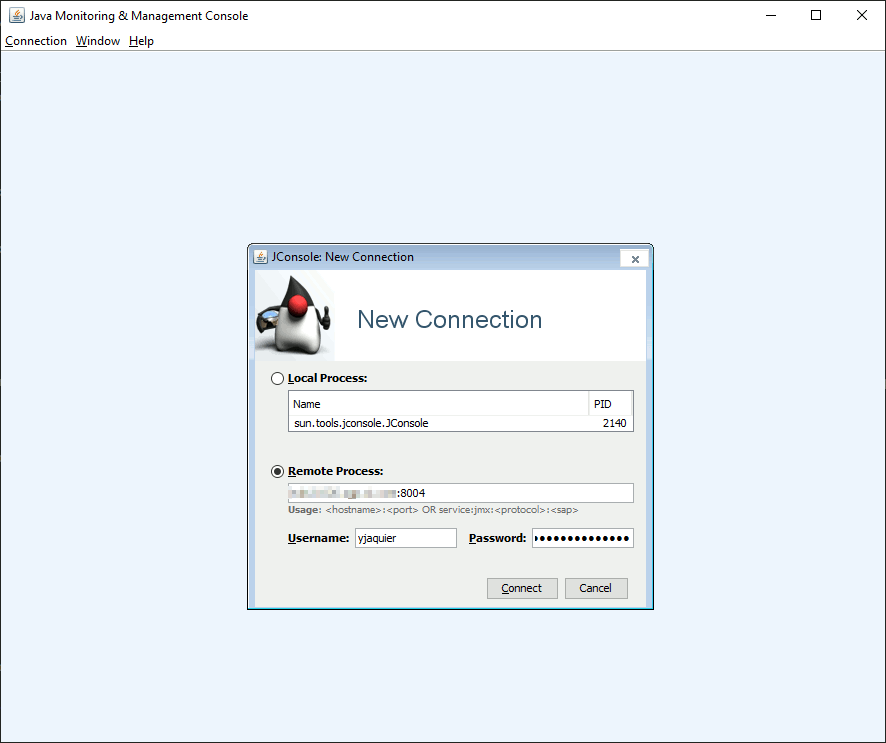
And have the exact same display as the Linux release, in a way it is more convenient because from your desktop you can access to any Java process of your Hadoop cluster…
Hiveserver2 monitoring with Grafana
Coming back to Ambari configuration I have seen a strange list of parameters:
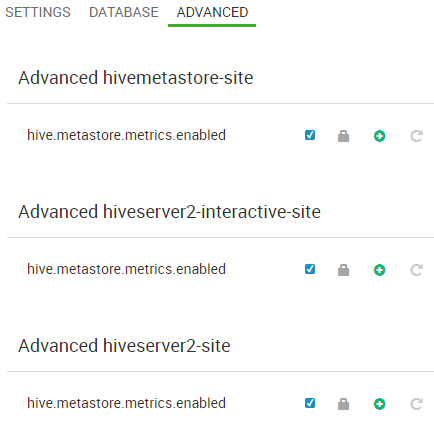
While in Confluence official docuementation I can see (https://cwiki.apache.org/confluence/display/Hive/Configuration+Properties#ConfigurationProperties-Metrics.1):

And this parameter is truly set to false in my environment:
0: jdbc:hive2://zookeeper01.domain.com:2181,zoo> set hive.server2.metrics.enabled; +-------------------------------------+ | set | +-------------------------------------+ | hive.server2.metrics.enabled=false | +-------------------------------------+ 1 row selected (0.251 seconds) |
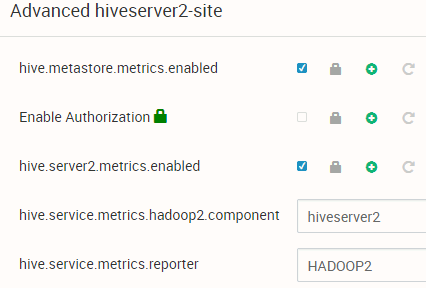
So clearly Ambari has a bug and the parameter in “Advanced hiveserver2-site” is not the good one. I have decided to add this in “Custom hiveserver2-site”, saved and restarted required component to end up with a strange behavior. the parameter got moved to “Advanced hiveserver2-site” with a checkbox (like it should have been since the beginning):
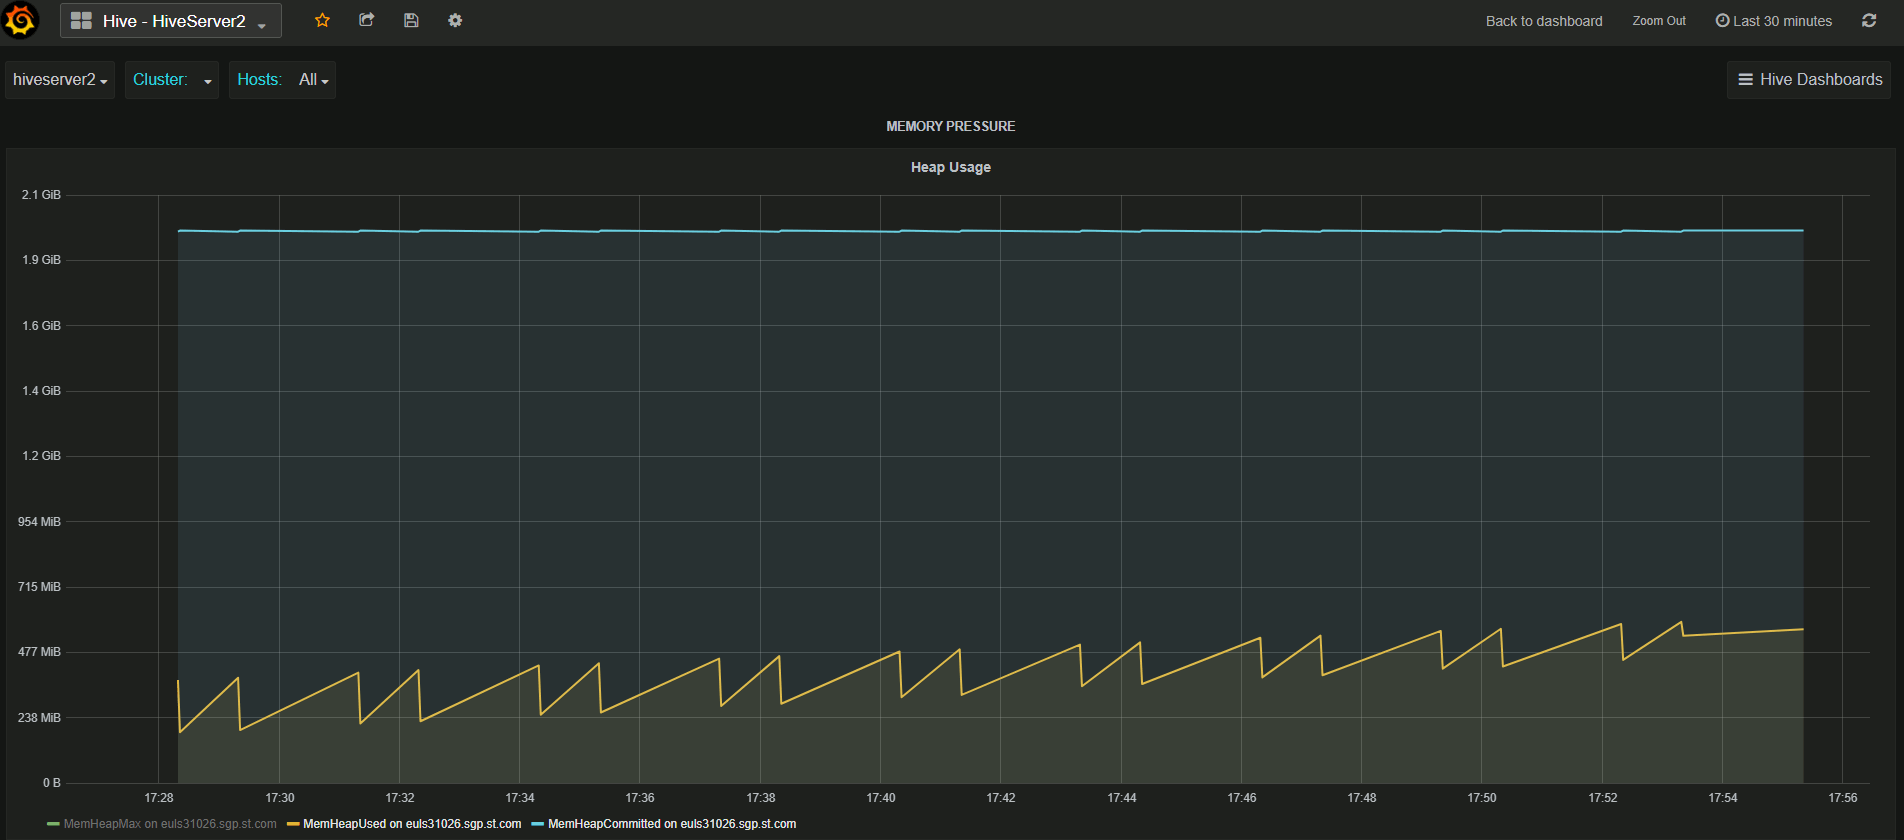
Back in Ambari I have modified the Hiveserver2 chart to use default.General.memory.heap.max, default.General.memory.heap.used and default.General.memory.heap.committed metrics to finally get:
References
- Java SE Monitoring and Management Guide
- Using JMX for accessing HDFS metrics
- How to enable JMX port for Namenode and Datanode in Hadoop from Ambari
- Hive Configuration Properties Metrics


