Table of contents
Preamble
Monitoring tools is part of our journey to slowly but constantly increasing our internal expertise on PostgreSQL. So far this is not part of our IT standards but fact is that that few applications already started to use it.
In parallel of PostgreSQL community edition you might have heard about Enterprise DB that propose a commercial offer on PostgreSQL said to be compatible with Oracle. With the clear goal to reduce your Oracle fees in migrating to EnterpriseDB. So far this is not yet a goal for us and we just aim to stick to community PostgreSQL and increase our internal knowledge before going further…
So I have decided to start to have a look and increase my knowledge on enterprise features that are key for us:
- Backup and restore
- Monitoring tools
This blog post will be on PostgreSQL monitoring tools as this is the most appealing part and is the part that helps you not to be blind in front of problems…
I plan to start small this blog post and enrich it if I test new monitoring tools in future. The plan is also to compare them versus the commercial offer of EnterpriseDB: PostgreSQL Enterprise Manager. If trial keys are available I also plan to add other commercial products. I will also mainly focus on on-premise product as our databases are mostly on-premise.
Looking at the free and open source products available out there I tend to say that it sounds difficult to me for paid competition…
Preference so far:
- PGWatch
- Percona Monitoring and Management
- Postgres Enterprise Manager
- OmniDB
- pgAdmin
pgAdmin
PgAdmin that is one of the most famous free and open source PostgreSQL monitoring tool.
Step zero, if like me you are behind a corporate proxy, is to configure your Python pip to go on internet by creating the /etc/pip.conf file similar to below (I have also decided to use a dedicated Linux account, pgadmin, to run it):
[pgadmin@server ~]$ cat /etc/pip.conf [global] extra-index-url=https://www.piwheels.org/simple proxy = http://account:password@proxy_server.domain.com:proxy_port/ trusted-host = pypi.python.org pypi.org www.piwheels.org files.pythonhosted.org |
Create and activate a Python vitual environment with (Install Python 3 on your server using your Linux distribution repository):
[pgadmin@server ~]$ cd /www/pgadmin/ [pgadmin@server pgadmin]$ python3 -m venv pgadmin4 [pgadmin@server pgadmin]$ source pgadmin4/bin/activate |
Most probably you will have to upgrade pip if you get below error message:
WARNING: You are using pip version 21.1.2; however, version 21.1.3 is available.
You should consider upgrading via the '/www/pgadmin/pgadmin4/bin/python3 -m pip install --upgrade pip' command. |
Use:
(pgadmin4) [pgadmin@server ~]$ pip install --upgrade pip |
Create and give ownership to your pgAdmin Linux account to directory /var/log/pgadmin.
Finally install pgAdmin 4 with (current version as a time of writing this article is 5.4):
pip install pgadmin4 |
Execute it with:
(pgadmin4) [pgadmin@server pgadmin]$ nohup pgadmin4 > pgadmin4.out & [1] 22676 |
To generate a bit of activity and understand how it works I have initialized pgBench. I have decided to create a dedicated database for pgBench, this must be done upfront using:
create database pgbenchdb; |
Then I created the pgbench datamodel using (you must plan for 5GB data storage):
pgbench --host=server2.domain.com --port=5433 --user=postgres --initialize --scale=100 pgbenchdb |
If you mess up or want to delete the pgbench table use:
pgbench --host=server2.domain.com --port=5433 --user=postgres --initialize --init-steps=d pgbenchdb |
Most probably you will fill the WAL directory so use something like (never do this is production ! But here I assume you are using a test server where you don’t care about recovery). First display mode to see what PosgreSQL would do:
[postgres@server ~]$ pg_archivecleanup -d -n /postgres/13/data/pg_wal/ 0000000300000000000000D0 pg_archivecleanup: keeping WAL file "/postgres/13/data/pg_wal//0000000300000000000000D0" and later /postgres/13/data/pg_wal//0000000300000000000000B9 pg_archivecleanup: file "/postgres/13/data/pg_wal//0000000300000000000000B9" would be removed /postgres/13/data/pg_wal//0000000300000000000000BA pg_archivecleanup: file "/postgres/13/data/pg_wal//0000000300000000000000BA" would be removed /postgres/13/data/pg_wal//0000000300000000000000BB pg_archivecleanup: file "/postgres/13/data/pg_wal//0000000300000000000000BB" would be removed /postgres/13/data/pg_wal//0000000300000000000000BC pg_archivecleanup: file "/postgres/13/data/pg_wal//0000000300000000000000BC" would be removed /postgres/13/data/pg_wal//0000000300000000000000BD pg_archivecleanup: file "/postgres/13/data/pg_wal//0000000300000000000000BD" would be removed /postgres/13/data/pg_wal//0000000300000000000000BE pg_archivecleanup: file "/postgres/13/data/pg_wal//0000000300000000000000BE" would be removed /postgres/13/data/pg_wal//0000000300000000000000BF pg_archivecleanup: file "/postgres/13/data/pg_wal//0000000300000000000000BF" would be removed /postgres/13/data/pg_wal//0000000300000000000000C0 pg_archivecleanup: file "/postgres/13/data/pg_wal//0000000300000000000000C0" would be removed /postgres/13/data/pg_wal//0000000300000000000000C1 pg_archivecleanup: file "/postgres/13/data/pg_wal//0000000300000000000000C1" would be removed /postgres/13/data/pg_wal//0000000300000000000000C2 pg_archivecleanup: file "/postgres/13/data/pg_wal//0000000300000000000000C2" would be removed /postgres/13/data/pg_wal//0000000300000000000000C3 pg_archivecleanup: file "/postgres/13/data/pg_wal//0000000300000000000000C3" would be removed /postgres/13/data/pg_wal//0000000300000000000000C4 pg_archivecleanup: file "/postgres/13/data/pg_wal//0000000300000000000000C4" would be removed /postgres/13/data/pg_wal//0000000300000000000000C5 pg_archivecleanup: file "/postgres/13/data/pg_wal//0000000300000000000000C5" would be removed /postgres/13/data/pg_wal//0000000300000000000000C6 pg_archivecleanup: file "/postgres/13/data/pg_wal//0000000300000000000000C6" would be removed /postgres/13/data/pg_wal//0000000300000000000000C7 pg_archivecleanup: file "/postgres/13/data/pg_wal//0000000300000000000000C7" would be removed /postgres/13/data/pg_wal//0000000300000000000000C8 pg_archivecleanup: file "/postgres/13/data/pg_wal//0000000300000000000000C8" would be removed /postgres/13/data/pg_wal//0000000300000000000000C9 pg_archivecleanup: file "/postgres/13/data/pg_wal//0000000300000000000000C9" would be removed /postgres/13/data/pg_wal//0000000300000000000000CA pg_archivecleanup: file "/postgres/13/data/pg_wal//0000000300000000000000CA" would be removed /postgres/13/data/pg_wal//0000000300000000000000CB pg_archivecleanup: file "/postgres/13/data/pg_wal//0000000300000000000000CB" would be removed /postgres/13/data/pg_wal//0000000300000000000000CC pg_archivecleanup: file "/postgres/13/data/pg_wal//0000000300000000000000CC" would be removed /postgres/13/data/pg_wal//0000000300000000000000CD pg_archivecleanup: file "/postgres/13/data/pg_wal//0000000300000000000000CD" would be removed /postgres/13/data/pg_wal//0000000300000000000000CE pg_archivecleanup: file "/postgres/13/data/pg_wal//0000000300000000000000CE" would be removed /postgres/13/data/pg_wal//0000000300000000000000CF pg_archivecleanup: file "/postgres/13/data/pg_wal//0000000300000000000000CF" would be removed |
Then the command to delete:
[postgres@server ~]$ pg_archivecleanup -d /postgres/13/data/pg_wal/ 0000000300000000000000D0 pg_archivecleanup: keeping WAL file "/postgres/13/data/pg_wal//0000000300000000000000D0" and later pg_archivecleanup: removing file "/postgres/13/data/pg_wal//0000000300000000000000B9" pg_archivecleanup: removing file "/postgres/13/data/pg_wal//0000000300000000000000BA" pg_archivecleanup: removing file "/postgres/13/data/pg_wal//0000000300000000000000BB" pg_archivecleanup: removing file "/postgres/13/data/pg_wal//0000000300000000000000BC" pg_archivecleanup: removing file "/postgres/13/data/pg_wal//0000000300000000000000BD" pg_archivecleanup: removing file "/postgres/13/data/pg_wal//0000000300000000000000BE" pg_archivecleanup: removing file "/postgres/13/data/pg_wal//0000000300000000000000BF" pg_archivecleanup: removing file "/postgres/13/data/pg_wal//0000000300000000000000C0" pg_archivecleanup: removing file "/postgres/13/data/pg_wal//0000000300000000000000C1" pg_archivecleanup: removing file "/postgres/13/data/pg_wal//0000000300000000000000C2" pg_archivecleanup: removing file "/postgres/13/data/pg_wal//0000000300000000000000C3" pg_archivecleanup: removing file "/postgres/13/data/pg_wal//0000000300000000000000C4" pg_archivecleanup: removing file "/postgres/13/data/pg_wal//0000000300000000000000C5" pg_archivecleanup: removing file "/postgres/13/data/pg_wal//0000000300000000000000C6" pg_archivecleanup: removing file "/postgres/13/data/pg_wal//0000000300000000000000C7" pg_archivecleanup: removing file "/postgres/13/data/pg_wal//0000000300000000000000C8" pg_archivecleanup: removing file "/postgres/13/data/pg_wal//0000000300000000000000C9" pg_archivecleanup: removing file "/postgres/13/data/pg_wal//0000000300000000000000CA" pg_archivecleanup: removing file "/postgres/13/data/pg_wal//0000000300000000000000CB" pg_archivecleanup: removing file "/postgres/13/data/pg_wal//0000000300000000000000CC" pg_archivecleanup: removing file "/postgres/13/data/pg_wal//0000000300000000000000CD" pg_archivecleanup: removing file "/postgres/13/data/pg_wal//0000000300000000000000CE" pg_archivecleanup: removing file "/postgres/13/data/pg_wal//0000000300000000000000CF" |
Finally issue a benchmark using:
pgbench --host=server2.domain.com --port=5433 --user=postgres --client=10 --jobs=2 --transactions=10000 pgbenchdb |
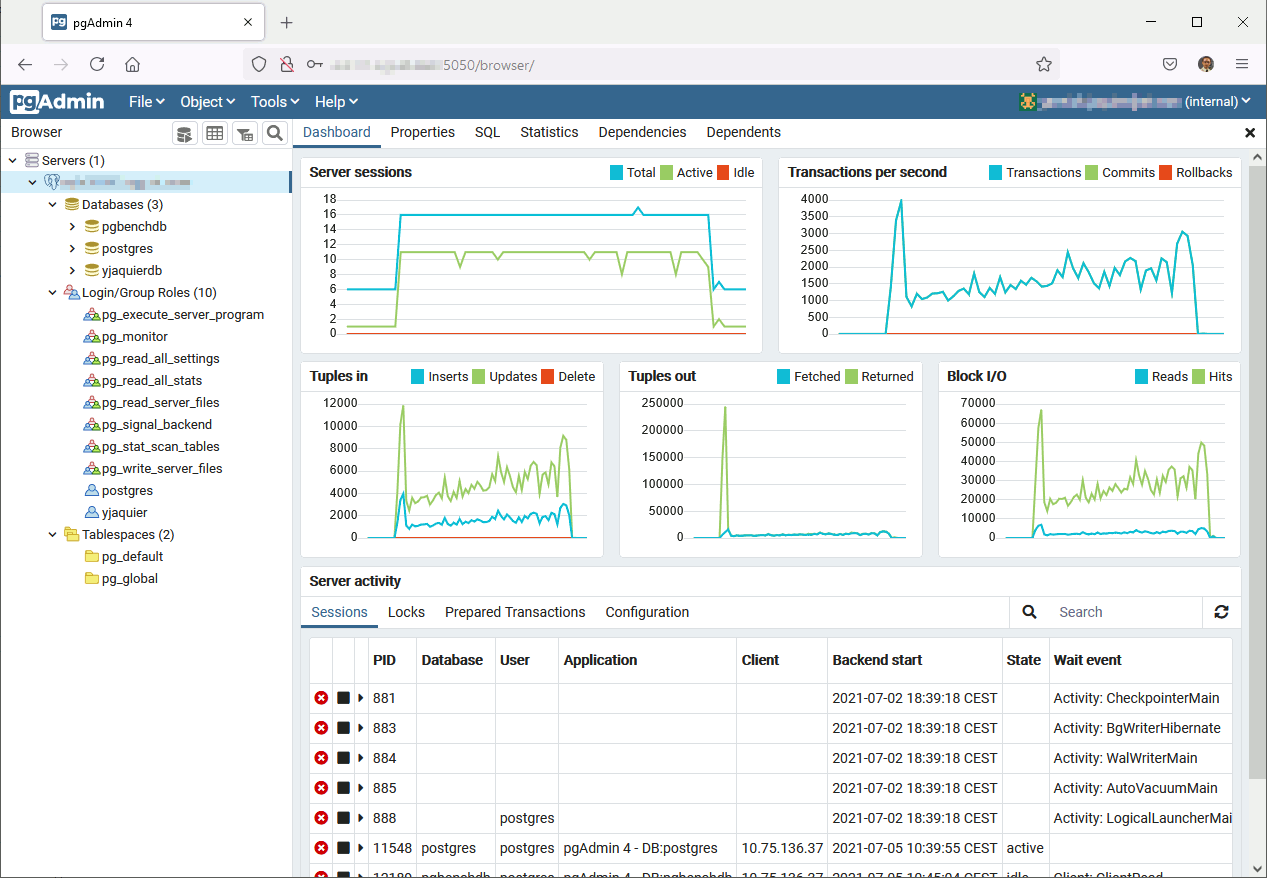
We can see that pgAdmin is providing interesting graphs of your server or individual database performance:
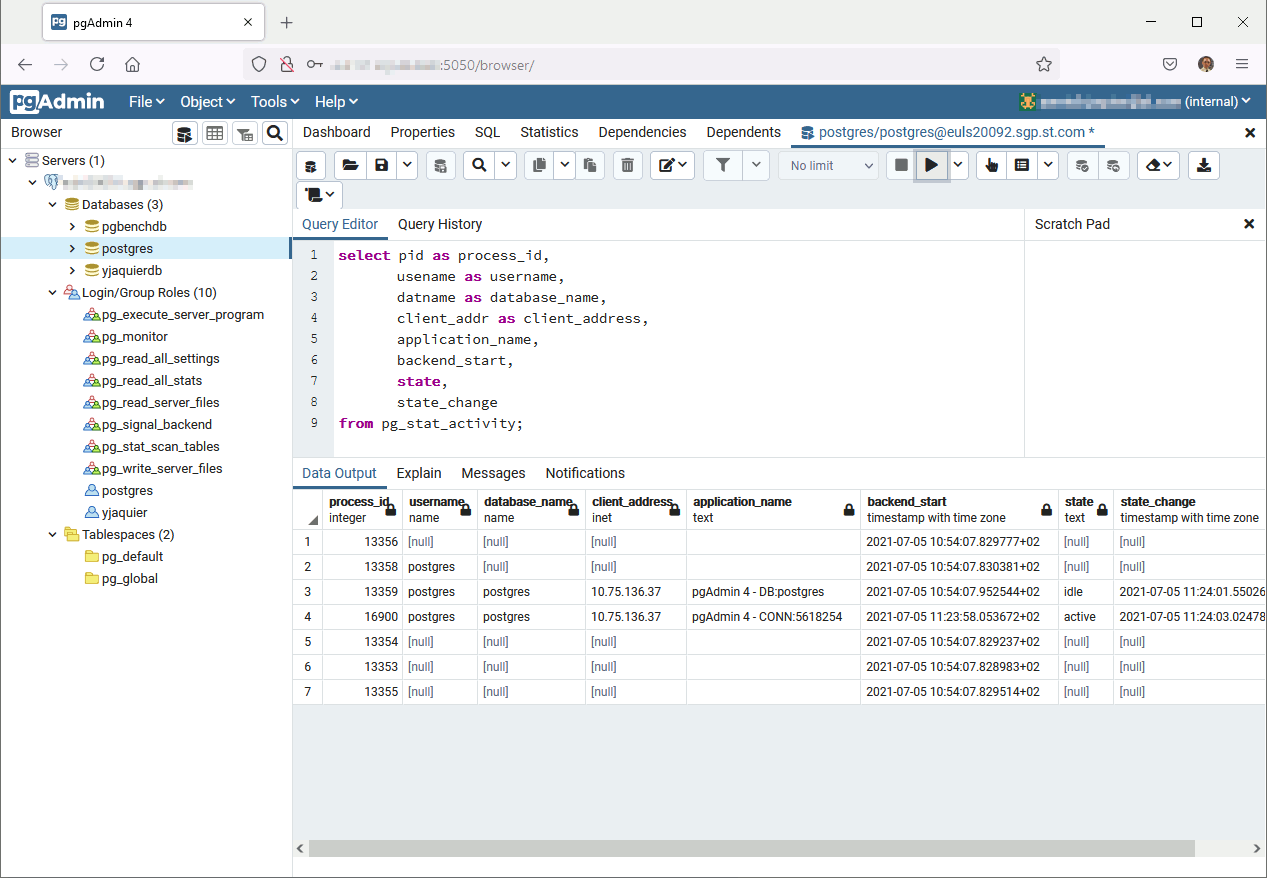
Pgadmin is also a neat graphical query editor:
Overall nice monitoring tools even if a bit complex to navigate in menu and options. The chart part could be more exhaustive and you cannot add your own charts…
Postgres Enterprise Manager
This tool is not free and you need an EnterpriseDB subscription to use it. I have created a trial account and you can test the tool for 60 days. For this I have used two virtual machines running Oracle Linux 8. One for the Postgres Enterprise Manager (PEM) repository and one for the client PostgreSQL Instance (deployed with a PEM agent).
Postgres Enterprise Manager Server
My PEM Server will be my first virtual machine called server1.domain.com (192.168.56.101). I have started by creating the PostgreSQL 13 repository database in /postgres/13/data directory and created a service with below, taken from official documentation, startup file:
[root@server1 ~]# cat /etc/systemd/system/postgresql.service [Unit] Description=PostgreSQL database server Documentation=man:postgres(1) [Service] Type=notify User=postgres ExecStart=/usr/pgsql-13/bin/postgres -D /postgres/13/data ExecReload=/bin/kill -HUP $MAINPID KillMode=mixed KillSignal=SIGINT TimeoutSec=0 [Install] WantedBy=multi-user.target |
Reload systemd daemon with:
systemctl daemon-reload |
Now you can use systemctl stopstart/status postgresql (PEM Server will do it too):
[root@server1 ~]# systemctl status postgresql ● postgresql.service - PostgreSQL database server Loaded: loaded (/etc/systemd/system/postgresql.service; disabled; vendor preset: disabled) Active: active (running) since Mon 2021-07-05 12:43:56 CEST; 12min ago Docs: man:postgres(1) Main PID: 9781 (postgres) Tasks: 17 (limit: 49502) Memory: 144.9M CGroup: /system.slice/postgresql.service ├─ 9781 /usr/pgsql-13/bin/postgres -D /postgres/13/data ├─ 9782 postgres: logger ├─ 9784 postgres: checkpointer ├─ 9785 postgres: background writer ├─ 9786 postgres: walwriter ├─ 9787 postgres: autovacuum launcher ├─ 9788 postgres: stats collector ├─ 9789 postgres: logical replication launcher ├─ 9850 postgres: agent1 pem 127.0.0.1(60830) idle ├─ 9871 postgres: agent1 pem 127.0.0.1(60832) idle ├─ 9898 postgres: agent1 pem 127.0.0.1(60836) idle ├─ 9904 postgres: postgres postgres 127.0.0.1(60838) idle ├─ 9910 postgres: agent1 pem 127.0.0.1(60840) idle ├─ 9919 postgres: agent1 pem 127.0.0.1(60842) idle ├─10358 postgres: postgres pem 127.0.0.1(60944) idle ├─10359 postgres: postgres pem 127.0.0.1(60946) idle └─10360 postgres: postgres pem 127.0.0.1(60948) idle Jul 05 12:43:56 server1.domain.com systemd[1]: Starting PostgreSQL database server... Jul 05 12:43:56 server1.domain.com postgres[9781]: 2021-07-05 12:43:56.615 CEST [9781] LOG: redirecting log output to logging collector process Jul 05 12:43:56 server1.domain.com postgres[9781]: 2021-07-05 12:43:56.615 CEST [9781] HINT: Future log output will appear in directory "log". Jul 05 12:43:56 server1.domain.com systemd[1]: Started PostgreSQL database server. |
To be able to connect locally (PEM server access to 127.0.0.1) and from remote agent I have changed in postgresql.conf:
listen_addresses = 'localhost,server1.domain.com' |
And in pg_hba.conf:
host all postgres 0.0.0.0/0 trust |
As instructed install the EDB repository with:
dnf -y install https://yum.enterprisedb.com/edbrepos/edb-repo-latest.noarch.rpm |
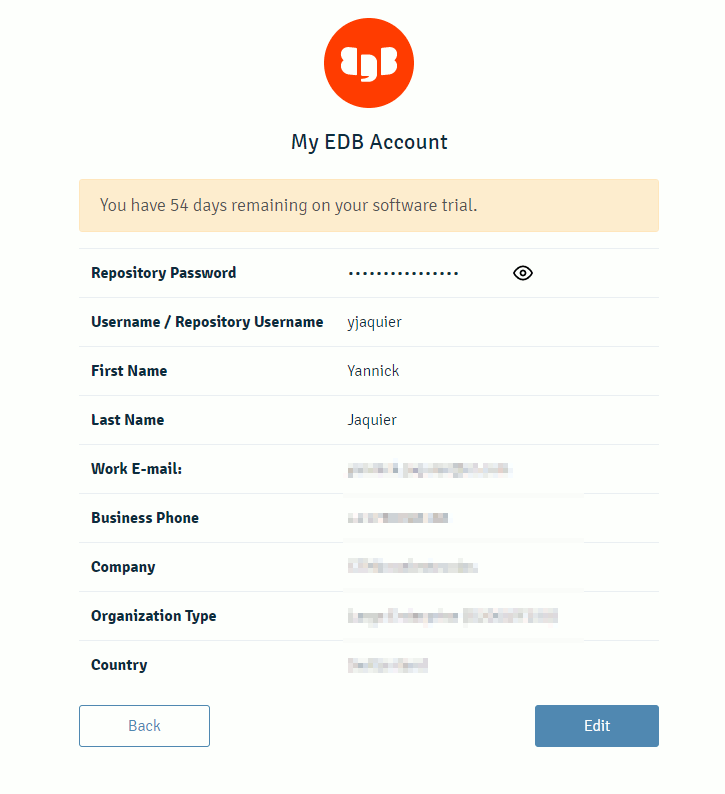
And change in /etc/yum.repos.d/edb.repo username and password with provided EDB information. Actually this is not the account you use to connect to EDB website that has to be used but the one provided when you go in your profile (I did that stupid mistake so sharing). Click on the eye icon to read the password:
Install PEM server with:
dnf install edb-pem |
The interactive configuration tool is /usr/edb/pem/bin/configure-pem-server.sh. If for any reason you want to restart the configuration from scratch the configuration file is (not documented):
[root@server1 ~]# cat /usr/edb/pem/share/.install-config PEM_INSTALLATION_TYPE=1 PG_INSTALL_PATH=/usr/pgsql-13 SUPERUSER=postgres HOST=127.0.0.1 PORT=5432 AGENT_CERTIFICATE_PATH=/root/.pem/ PEM_PYTHON=python3 PEM_APP_HOST= WEB_PEM_CONFIG=/usr/edb/pem/web/config_setup.py CIDR_ADDR=0.0.0.0/0 DB_UNIT_FILE=postgresql PEM_SERVER_SSL_PORT=8443 |
Once you have answered to the few question the PEM server is configured. So far I have not understood on how to stop/start/status the PEM server process and each time I use the configure-pem-server.sh script to start it. Not very convenient…
Postgres Enterprise Manager Agent
My PEM Agent server will be my second virtual machine called server2.domain.com (192.168.56.102). Same as the server part you need to configure the EDB repository and insert inside the repository file your EDB account and password. The only package you have to install is the PEM Agent:
dnf install edb-pem-agent |
I have also configure on this client server a prostgreSQL instance where I have installed pgbench repository to generate some workload…
On this client node register the agent with the PostgreSQL repository instance. This is why I had to configure the PostgreSQL repository instance to accept connection from remote clients:
/usr/edb/pem/agent/bin/pemworker --register-agent |
Finally you control PEM Agent with systemd:
systemctl start pemagent |
Then this is where it is not crystal clear to me on how you need to add PEM Agent and PEM client servers to your repository. For me PEM Agent should be added automatically and when you must add them manually:
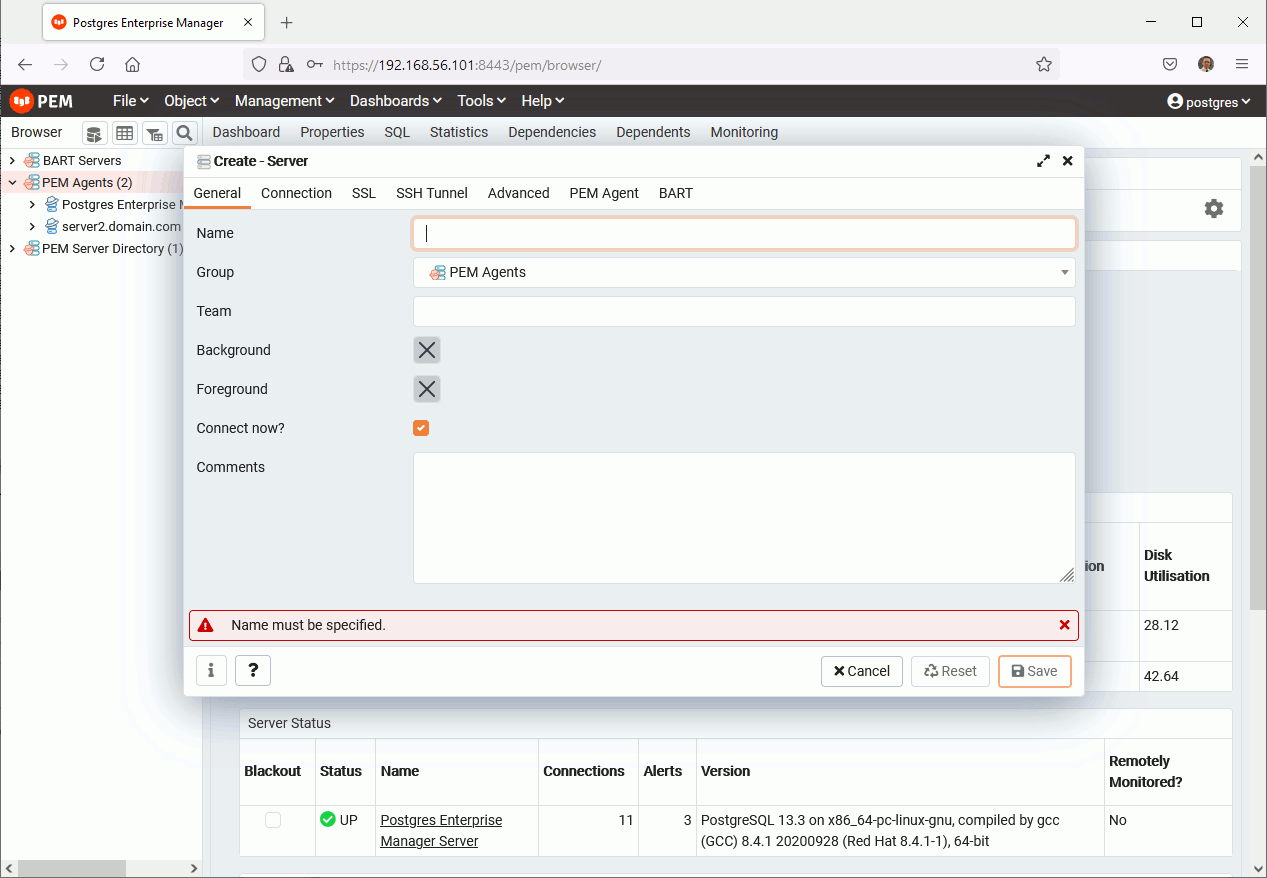
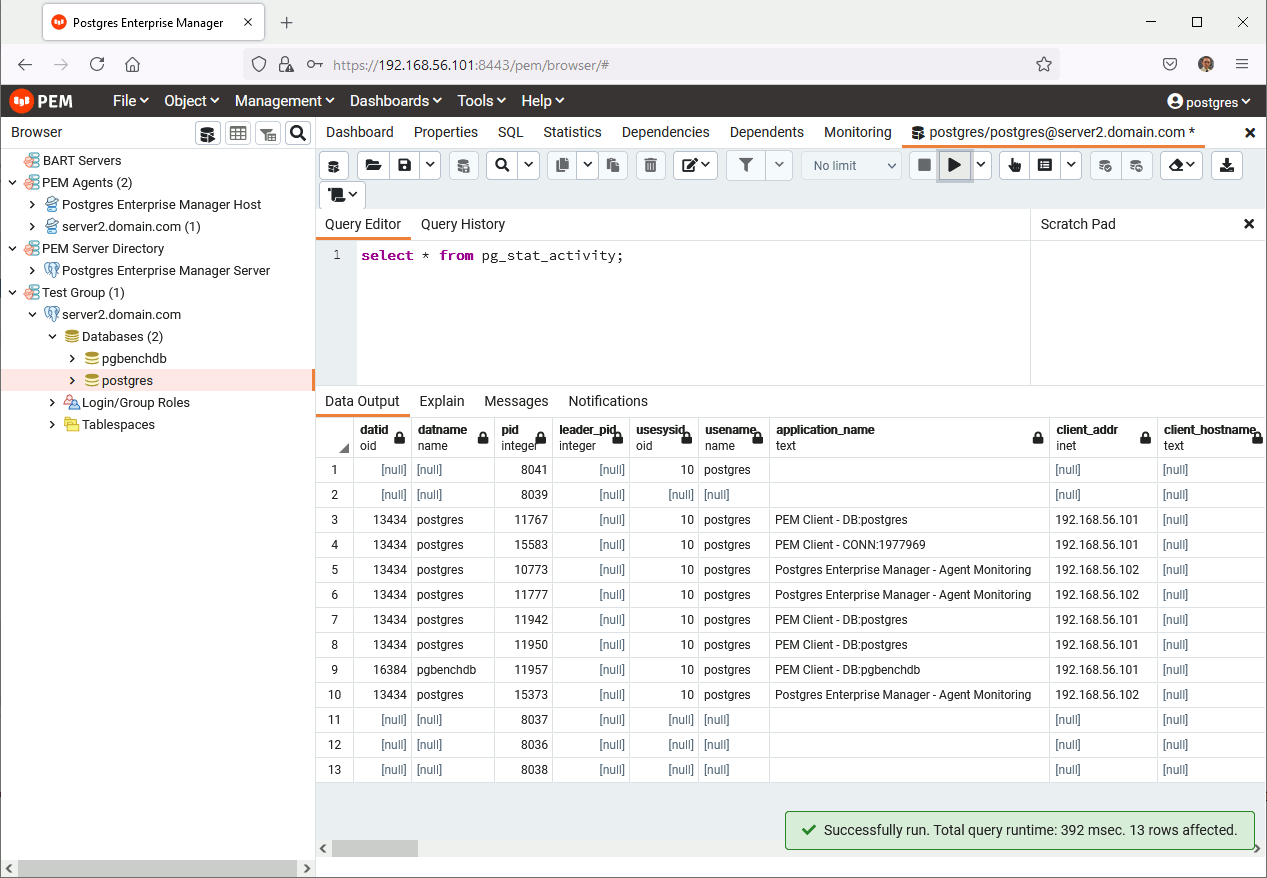
You do not see the databases list information and you need to add the server a second time (I added it in a specific group I created upfront) not using the PEM Agent sheet but the Connection one… Most probably I’m doing somethign wrong:

The tool has also a graphical query interface:
Overall the tool is quite complete with plenty of dashboard, alerts and probes (a check) that you can also customize and create on your own. If you have a magical query you can put everything in place to create a dashboard or an alert based on it.
Remark:
One point, same as me, that might not come immediately is the dashboard menu that is changing related to where you point on left menu (server, database, schema).
This is clearly one step beyond PgAdmin but it also takes the bad point of its ancestor. To be honest, overall, I have not been really impressed by the tool (also taking into account that the tool is not free). The tool is not bad but I was clearly expecting something much modern and easy to use for the UI. One nice added feature versus PgAdmin is the custom probes, alert and charts !! I would need to go deeper as I might have not understood it well…
OmniDB
Download the server package for your operating system:
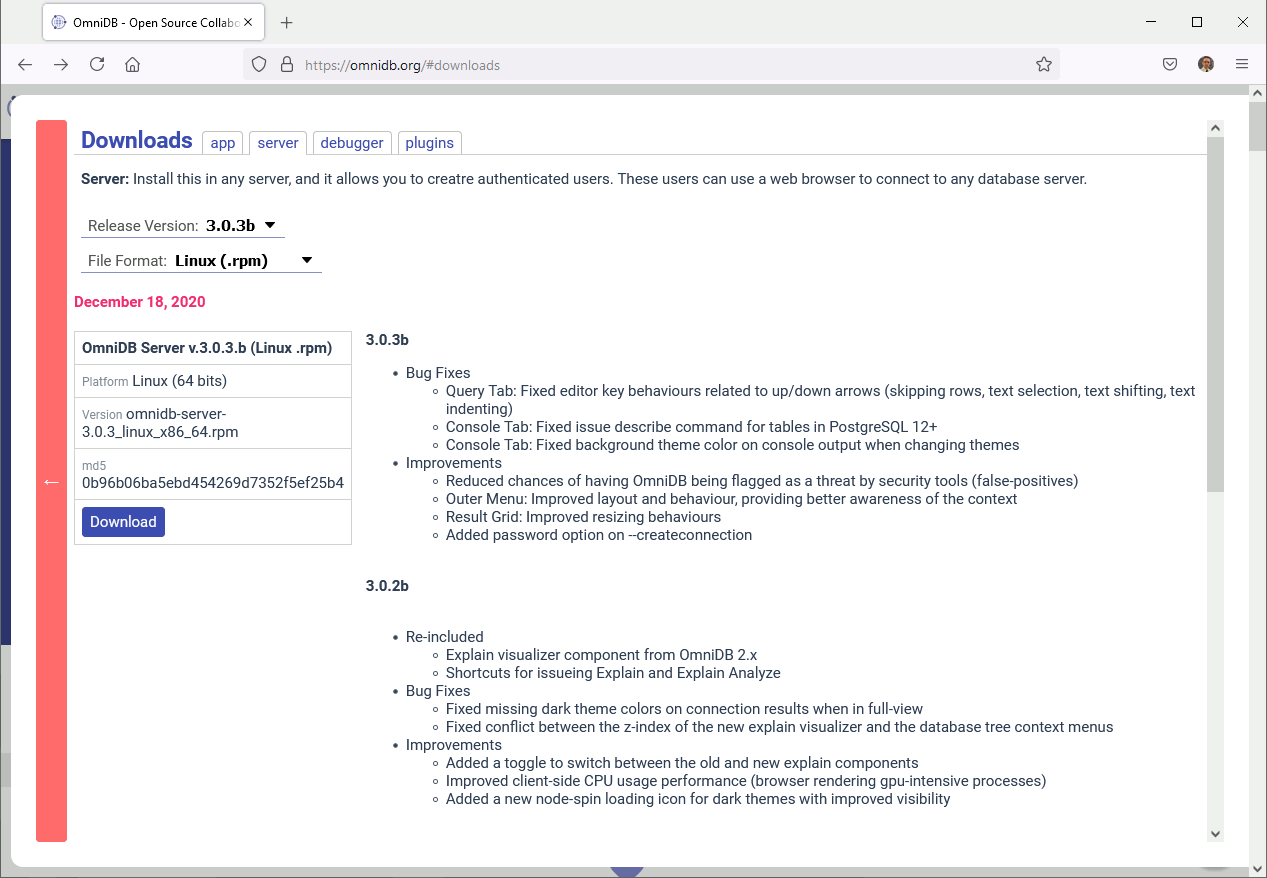
And for my Oracle Linux 8 virtual machine installation has been as simple as:
dnf install omnidb-server-3.0.3b_linux_x86_64.rpm |
To connect remotely I had to change the listen address at /root/.omnidb/omnidb-server/config.py configuration file. Execute the omniDB server web interface with:
[root@server1 ~]# omnidb-server Running database migrations... Operations to perform: Apply all migrations: OmniDB_app, admin, auth, contenttypes, sessions, social_django Running migrations: No migrations to apply. Starting OmniDB server... Checking port availability... Starting server OmniDB 3.0.3b at 192.168.56.101:8000. Open OmniDB in your favorite browser Press Ctrl+C to exit |
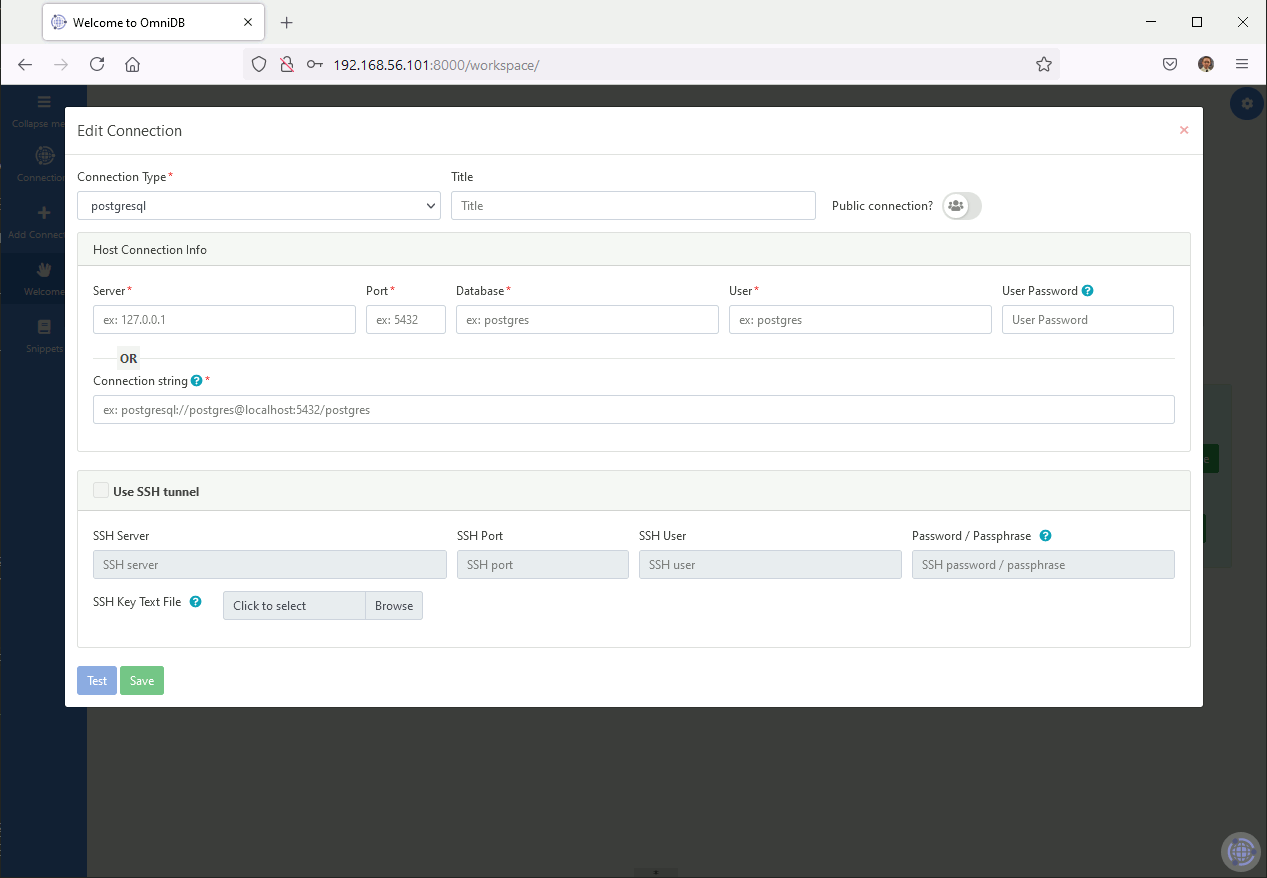
In the web interface (default account is admin/admin) add a new PostgreSQL server with (other database flavor are available):
The tool has a graphical query part (all have more or less):
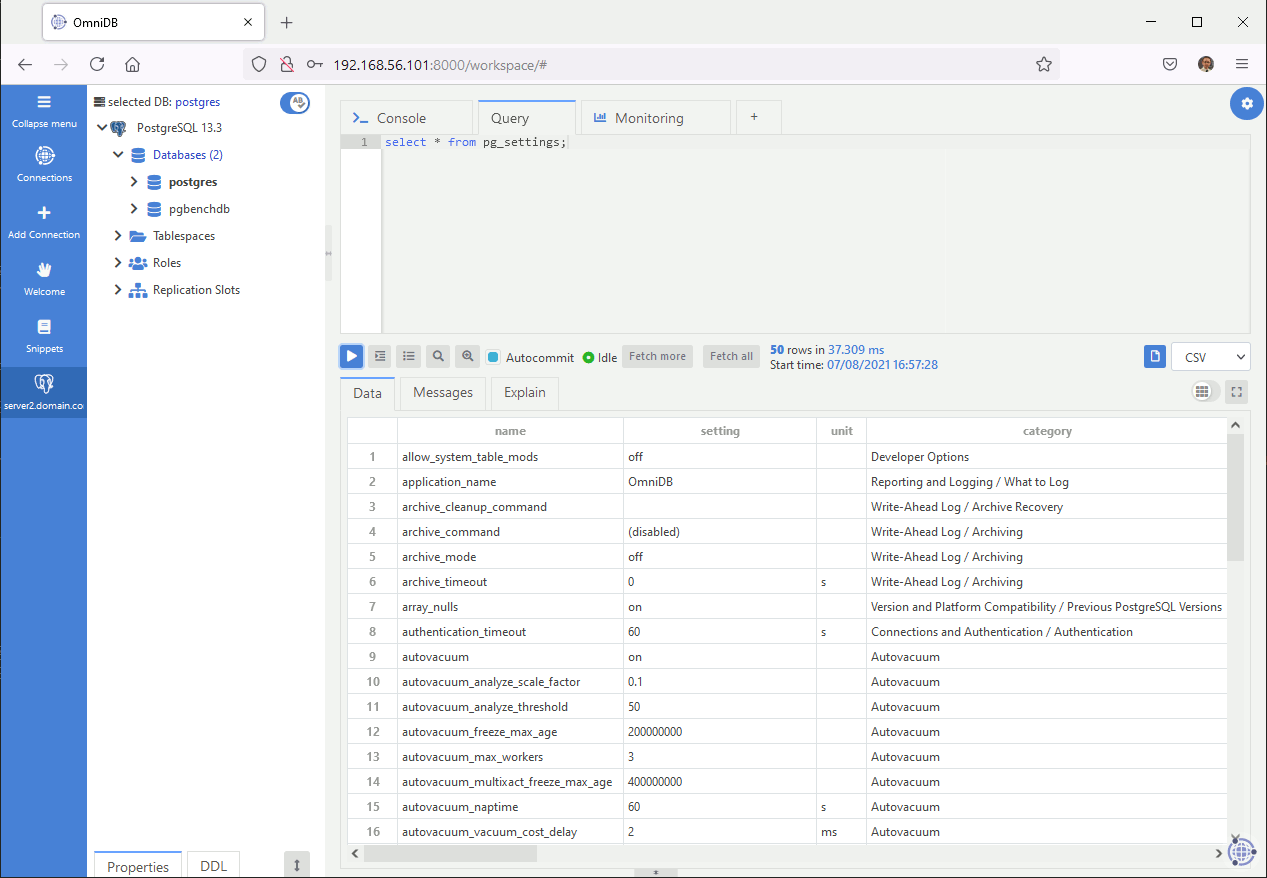
And a monitoring chart part:
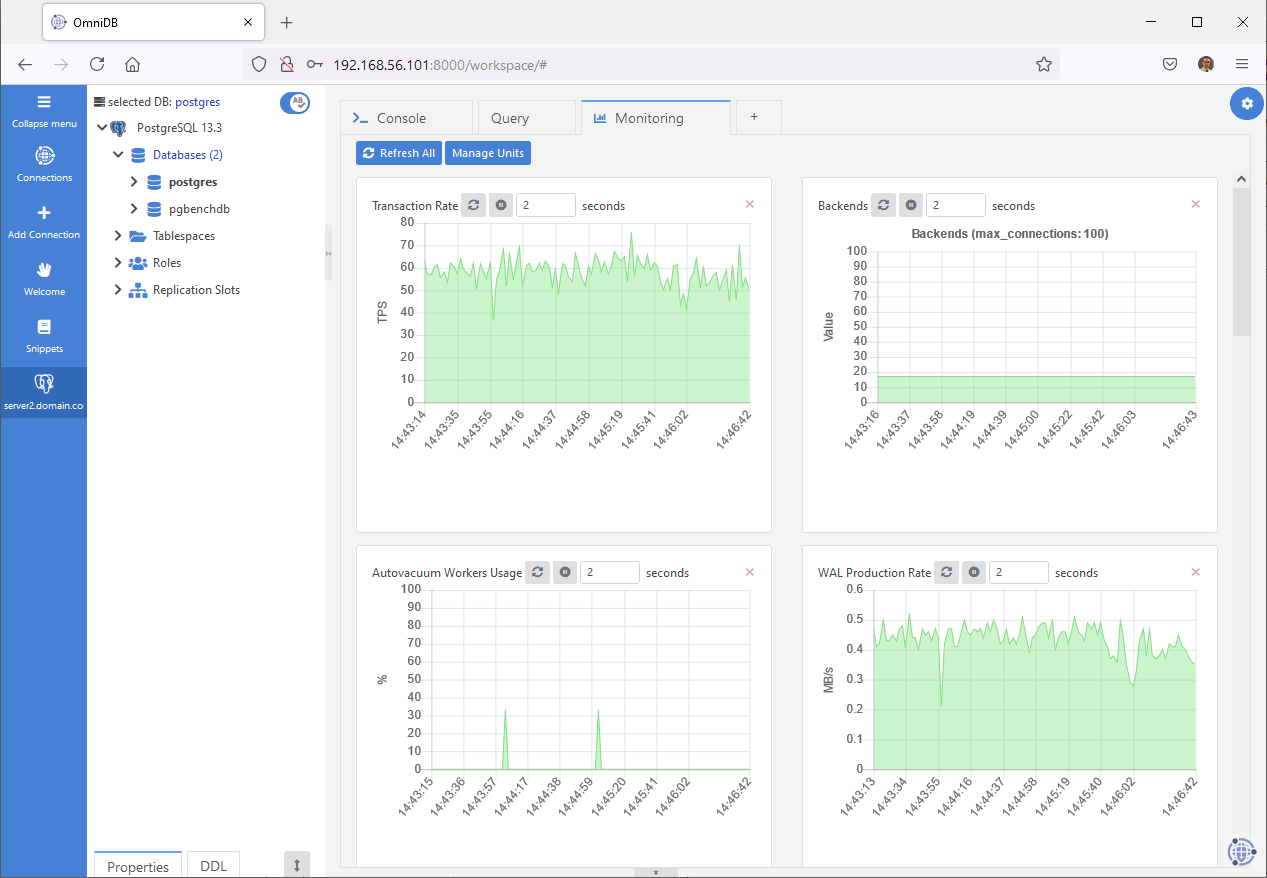
Charts are neat (I really like them: really modern !) and the look and feel is really Web 2.0 but you cannot add your own custom charts while PEM has this capability…
Percona Monitoring and Management
This free multi-databases monitoring tool is a free offer from Percona. It is based on the traditional server/agent model and based on Grafana. To have already played a bit with it I can already say that the look and feel is pretty neat.
Server
For the server part of Percona Monitoring and Management (PMM) you have to download a provided Docker image. On my Oracle Linux 8 virtual box I have decided to use Podman (similar to Docker but daemon less, open source and Linux native tool). The nice thing to transition to Podman is that commands are all the same…
Download Docker PMM server image with podman pull command. I had to configure my corporate proxy by setting HTTPS_PROXY environment variable and had also to add my proxy certificate. I am not re-entering into details as we have seen this already with docker and it’s almost the same with Podamn:
[root@server1 ~]# podman pull percona/pmm-server:2 ✔ docker.io/percona/pmm-server:2 Trying to pull docker.io/percona/pmm-server:2... Get "https://registry-1.docker.io/v2/": x509: certificate signed by unknown authority Error: Error initializing source docker://percona/pmm-server:2: error pinging docker registry registry-1.docker.io: Get "https://registry-1.docker.io/v2/": x509: certificate signed by unknown authority |
With proxy and certificates configured:
[root@server1 tmp]# podman pull percona/pmm-server:2 ✔ docker.io/percona/pmm-server:2 Trying to pull docker.io/percona/pmm-server:2... Getting image source signatures Copying blob 178efec65a21 done Copying blob 2d473b07cdd5 done Copying config 82d29be43d done Writing manifest to image destination Storing signatures 82d29be43d66377922dcb3b1cabe8e2cb5716a3b9a76bab8791736e465ba50be |
Once PMM is installed create a volume with
[root@server1 tmp]# podman create --volume /srv --name pmm-data percona/pmm-server:2 /bin/true 4dcc7c55603d01f4842ed524f5b7d983a67e16ff3d5a42dc84691d70c27eeba4 |
Run the container with:
[root@server1 tmp]# podman run --detach --restart always --publish 443:443 --volumes-from pmm-data --name pmm-server percona/pmm-server:2 5f5c4a6468f389951d1a44bfbf0f5492050c375d1bddcd2ab7fea25bcc791f45 [root@server1 tmp]# podman container list CONTAINER ID IMAGE COMMAND CREATED STATUS PORTS NAMES 5f5c4a6468f3 docker.io/percona/pmm-server:2 /opt/entrypoint.s... 27 seconds ago Up 25 seconds ago 0.0.0.0:443->443/tcp pmm-server |
Then you can access to https://192.168.56.101 (for me as I’m accessing my virtual server from my desktop), default login is admin/admin and you will immediately pormpted to change it.
Client
For the client I have chosen the rpm installation as it is by far the simplest to use. Download the rpm on your client server and install it with:
[root@server2 tmp]# dnf install pmm2-client-2.19.0-6.el8.x86_64.rpm Last metadata expiration check: 0:45:32 ago on Mon 12 Jul 2021 11:05:40 AM CEST. Dependencies resolved. ========================================================================================================================================================================================================================================= Package Architecture Version Repository Size ========================================================================================================================================================================================================================================= Installing: pmm2-client x86_64 2.19.0-6.el8 @commandline 43 M Transaction Summary ========================================================================================================================================================================================================================================= Install 1 Package Total size: 43 M Installed size: 154 M Is this ok [y/N]: y Downloading Packages: Running transaction check Transaction check succeeded. Running transaction test Transaction test succeeded. Running transaction Preparing : 1/1 Running scriptlet: pmm2-client-2.19.0-6.el8.x86_64 1/1 Installing : pmm2-client-2.19.0-6.el8.x86_64 1/1 Running scriptlet: pmm2-client-2.19.0-6.el8.x86_64 1/1 Verifying : pmm2-client-2.19.0-6.el8.x86_64 1/1 Installed: pmm2-client-2.19.0-6.el8.x86_64 Complete! [root@server2 tmp]# pmm-admin --version ProjectName: pmm-admin Version: 2.19.0 PMMVersion: 2.19.0 Timestamp: 2021-06-30 11:31:50 (UTC) FullCommit: 33d4f4a11ec6c46204d58e6ff6e08ad5742c8ae2 |
Register with the server repository with:
[root@server2 ~]# pmm-admin config --server-insecure-tls --server-url=https://admin:admin@192.168.56.101:443 Checking local pmm-agent status... pmm-agent is running. Registering pmm-agent on PMM Server... Registered. Configuration file /usr/local/percona/pmm2/config/pmm-agent.yaml updated. Reloading pmm-agent configuration... Configuration reloaded. Checking local pmm-agent status... pmm-agent is running. |
On your client PostgreSQL instance create a pmm account (chose a strong password, not like me):
postgres=# CREATE USER pmm WITH SUPERUSER ENCRYPTED PASSWORD 'pmm'; CREATE ROLE |
And update pg_hba.conf file to be able to connect with pmm account specifying a password:
[postgres@server2 data]$ grep local pg_hba.conf | grep -v "^#" local all pmm md5 local replication all trust local all all trust |
I have chosen to use pg_stat_statements for the monitoring extension, installed:
[root@server2 ~]# dnf install -y postgresql13-contrib.x86_64 |
Restart your PostgreSQL instance, check you can connect with pmm account and create extension with:
[postgres@server2 data]$ psql postgres pmm -c "\conninfo" Password for user pmm: You are connected to database "postgres" as user "pmm" via socket in "/var/run/postgresql" at port "5432". [postgres@server1 data]$ psql psql (13.3) Type "help" for help. postgres=# CREATE EXTENSION pg_stat_statements SCHEMA public; CREATE EXTENSION |
To add my client PostgreSQL instance with
[root@server2 ~]# pmm-admin add postgresql --username=pmm --password=pmm --server-url=https://admin:admin@192.168.56.101:443 --server-insecure-tls PostgreSQL Service added. Service ID : /service_id/2516642c-3237-4ef3-810f-6c2ecb6ddd6c Service name: server2.domain.com-postgresql [root@server2 tmp]# pmm-admin inventory list services Services list. Service type Service name Address and Port Service ID PostgreSQL server2.domain.com-postgresql 127.0.0.1:5432 /service_id/2516642c-3237-4ef3-810f-6c2ecb6ddd6c PostgreSQL pmm-server-postgresql 127.0.0.1:5432 /service_id/f7112f05-20e9-4933-8591-441fc93662f1 |
For a free product the look and the displayed informations are just awesome. Of course Grafana neat default look and feel helps but Percona have added a big bunch of cool features:

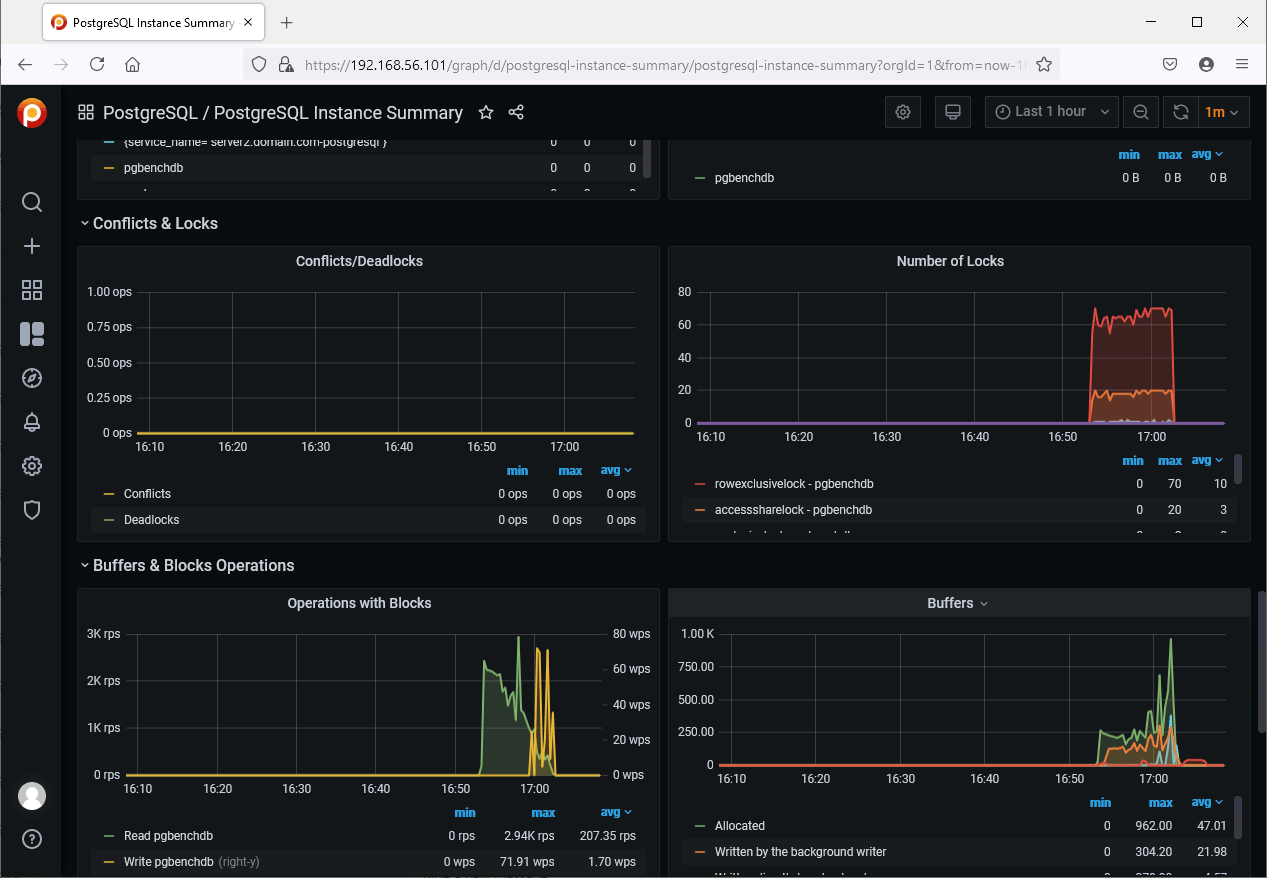
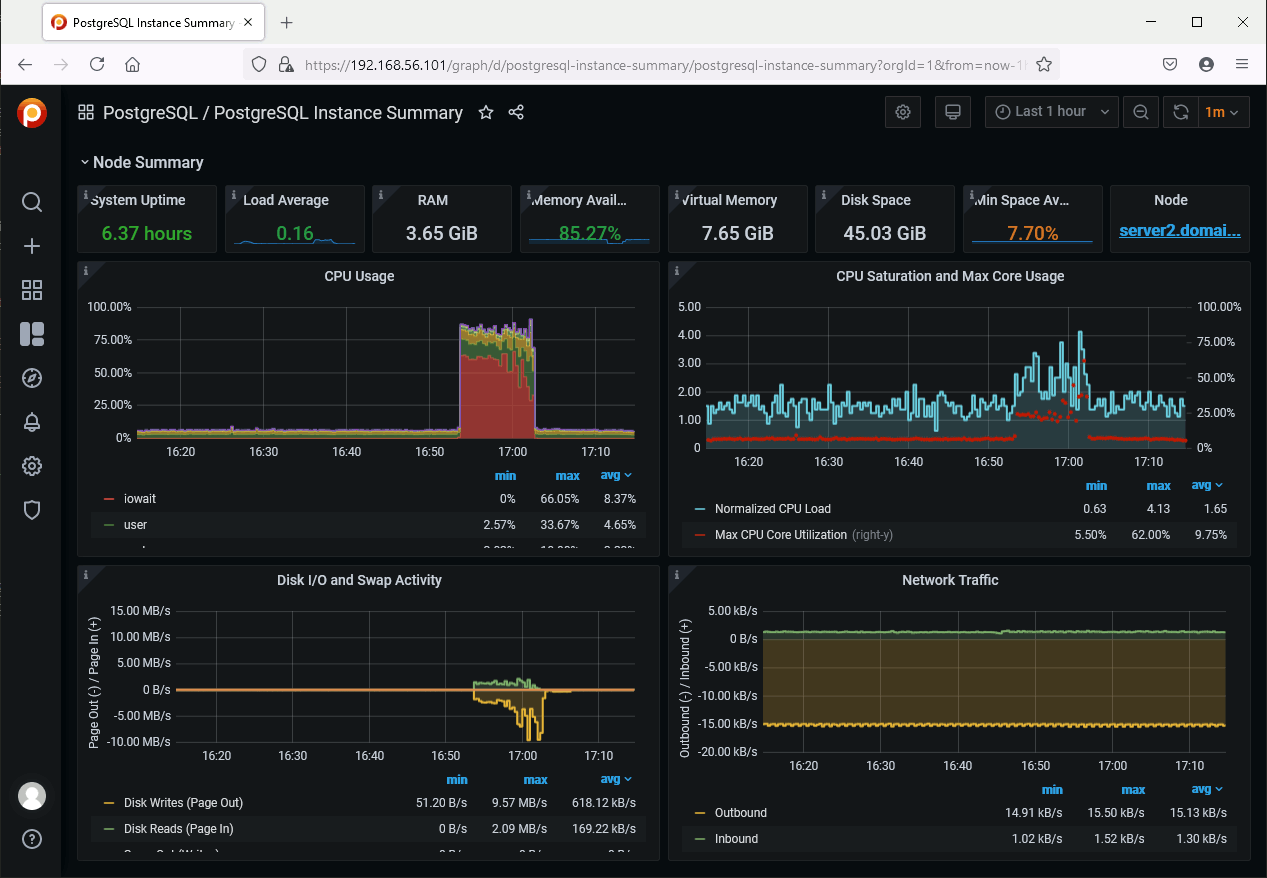
And obviously as it is Grafana there is zero limit in customization you can make…
PGWatch
I have obviously chosen the container installation and decided to use Podman that comes by default in my Oracle Linux distribution. I expected the installation to be seamless but at then end I have lost a couple of hours fighting with non working container. I have tried pgwatch2 and pgwatch2-postgres container but non of them worked and I had plenty of error like:
- ERROR 209 name ‘requests’ is not defined
- influxdb.exceptions.InfluxDBClientError: database not found: pgwatch2
I have decided to give a last try with image pull of pgwatch2-nonroot with:
[root@server1 ~]# podman pull cybertec/pgwatch2-nonroot ✔ docker.io/cybertec/pgwatch2-nonroot:latest Trying to pull docker.io/cybertec/pgwatch2-nonroot:latest... Getting image source signatures Copying blob 350caab5f3b5 skipped: already exists Copying blob 49ac0bbe6c8e skipped: already exists Copying blob 3386e6af03b0 skipped: already exists Copying blob 1a0f3a523f04 skipped: already exists Copying blob d1983a67e104 skipped: already exists Copying blob 91056c4070cb skipped: already exists Copying blob b23f24e6b1dd skipped: already exists Copying blob 1ed2f1c72460 skipped: already exists Copying blob effdfc7f950c skipped: already exists Copying blob 9a055164fb69 skipped: already exists Copying blob be763b7af1a3 skipped: already exists Copying blob 70fa32c9c857 done Copying blob 174f5722e61d done Copying blob 8be6b6bc9759 done Copying blob 7dea3ad5b533 done Copying blob c7f6ad956dfc done Copying blob 00e2d15bc136 done Copying blob fe00b1e59788 done Copying blob 40a688173fcd done Copying config 196f099da1 done Writing manifest to image destination Storing signatures 196f099da17eb6bb328ed274a7435371969ec73e8c99599a47e8686f22c6f1cc |
And run it with:
[root@server1 ~]# podman run -d --restart=unless-stopped --name pw2 -p 3000:3000 -p 8080:8080 -p 127.0.0.1:5432:5432 -e PW2_TESTDB=true cybertec/pgwatch2-nonroot:latest 4bd4150e3cb8991b3f9c4b24c2cc97973f5868bbf5dcbffa203e9e7c473fb465 [root@server1 ~]# podman container list -a CONTAINER ID IMAGE COMMAND CREATED STATUS PORTS NAMES 4bd4150e3cb8 docker.io/cybertec/pgwatch2:latest /pgwatch2/docker-... 5 seconds ago Up 3 seconds ago 0.0.0.0:3000->3000/tcp, 0.0.0.0:8080->8080/tcp pw2 |
With chosen option you see the backend PostgreSQL instance of Pgwatch2 (port 3000):
On the instance you plan to monitor create a monitoring account with:
CREATE ROLE pgwatch2 WITH LOGIN PASSWORD 'secret'; ALTER ROLE pgwatch2 CONNECTION LIMIT 3; GRANT pg_monitor TO pgwatch2; GRANT CONNECT ON DATABASE pgbenchdb TO pgwatch2; GRANT USAGE ON SCHEMA public TO pgwatch2; GRANT EXECUTE ON FUNCTION pg_stat_file(text) to pgwatch2; postgres=# show shared_preload_libraries; shared_preload_libraries -------------------------- pg_stat_statements (1 row) postgres=# show track_io_timing; track_io_timing ----------------- on (1 row) |
If required modify the pg_hba.conf file to allow remote connection using pgwatch2 account…
Then add the database in admin interface (port 8080) of Pgwatch2 (pg_stat_statements extention loaded in this database):
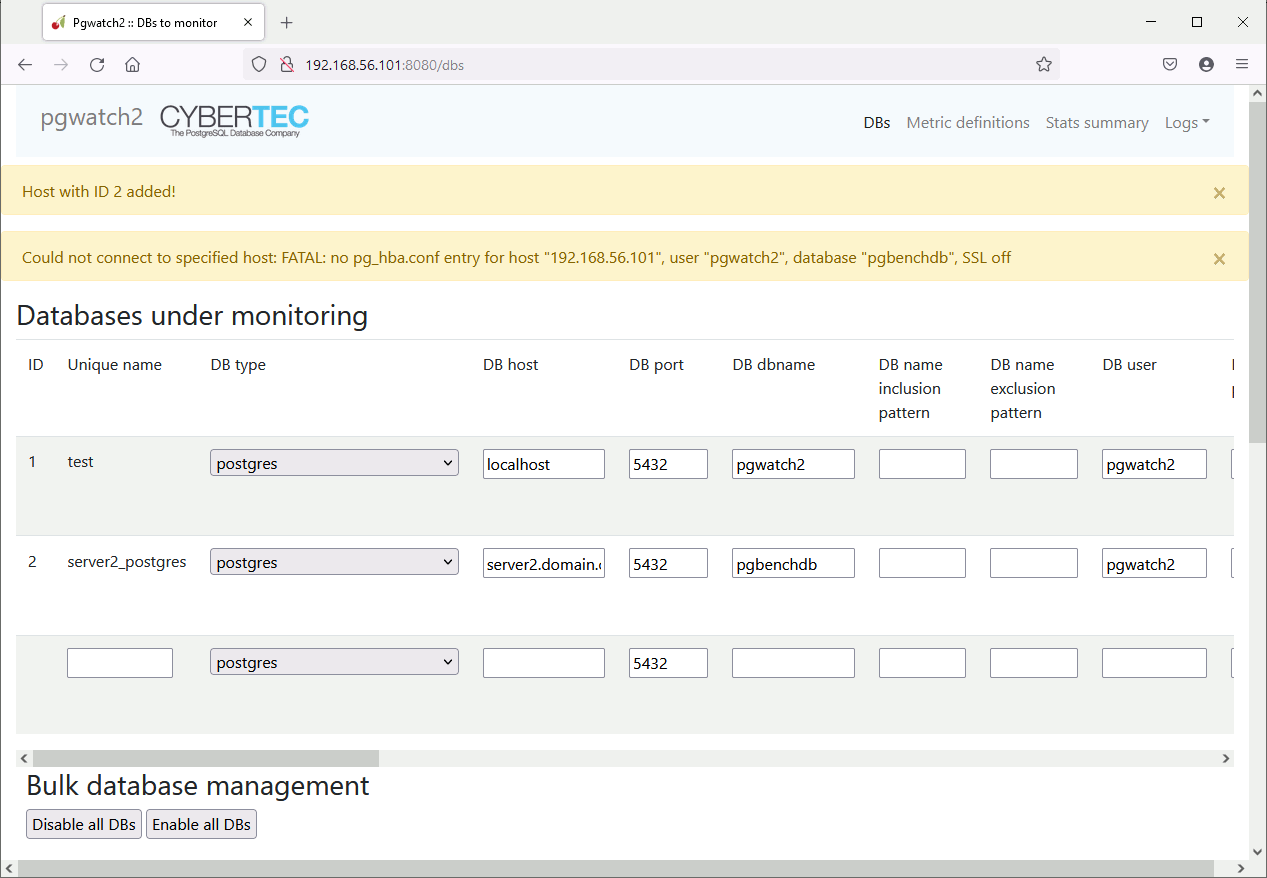
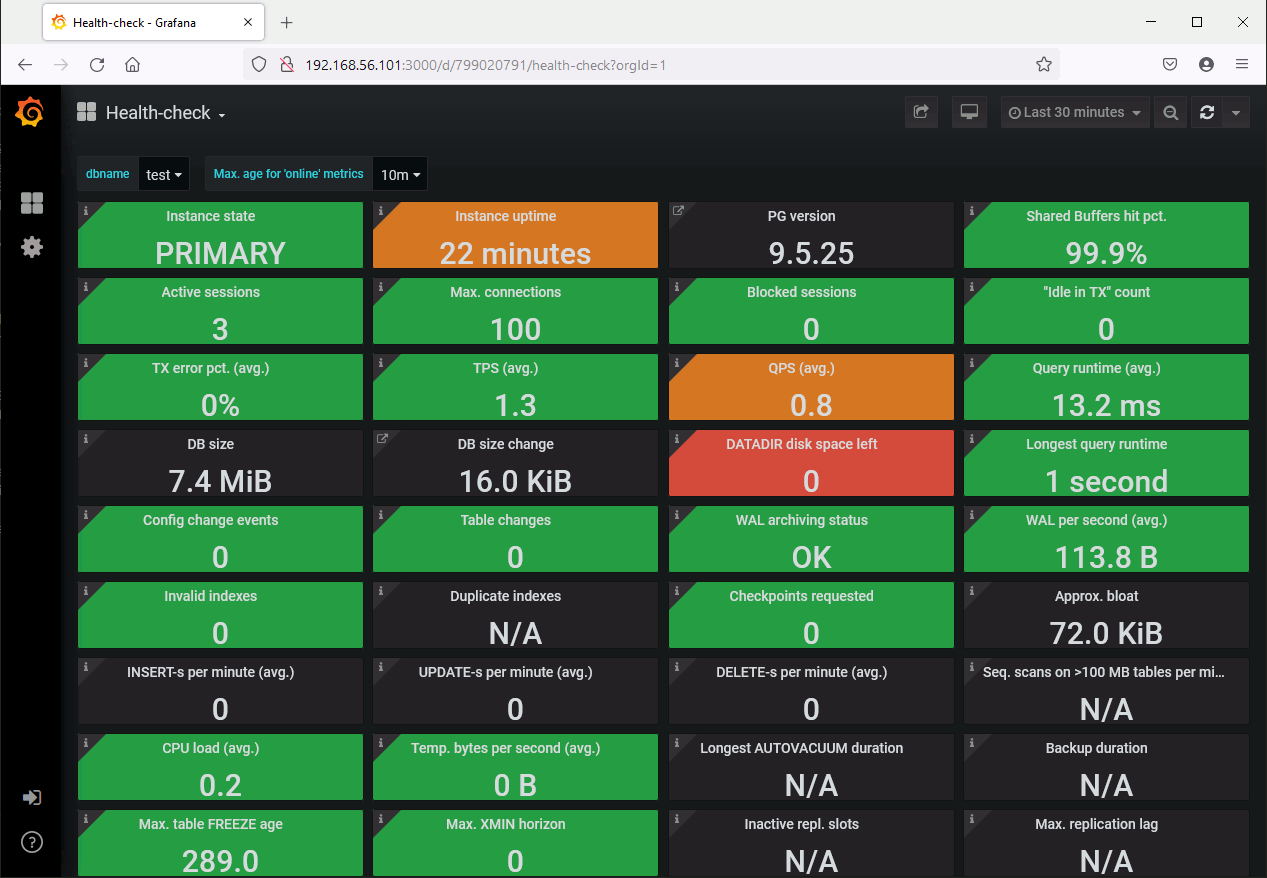
After a while you should see it in the dashboard:
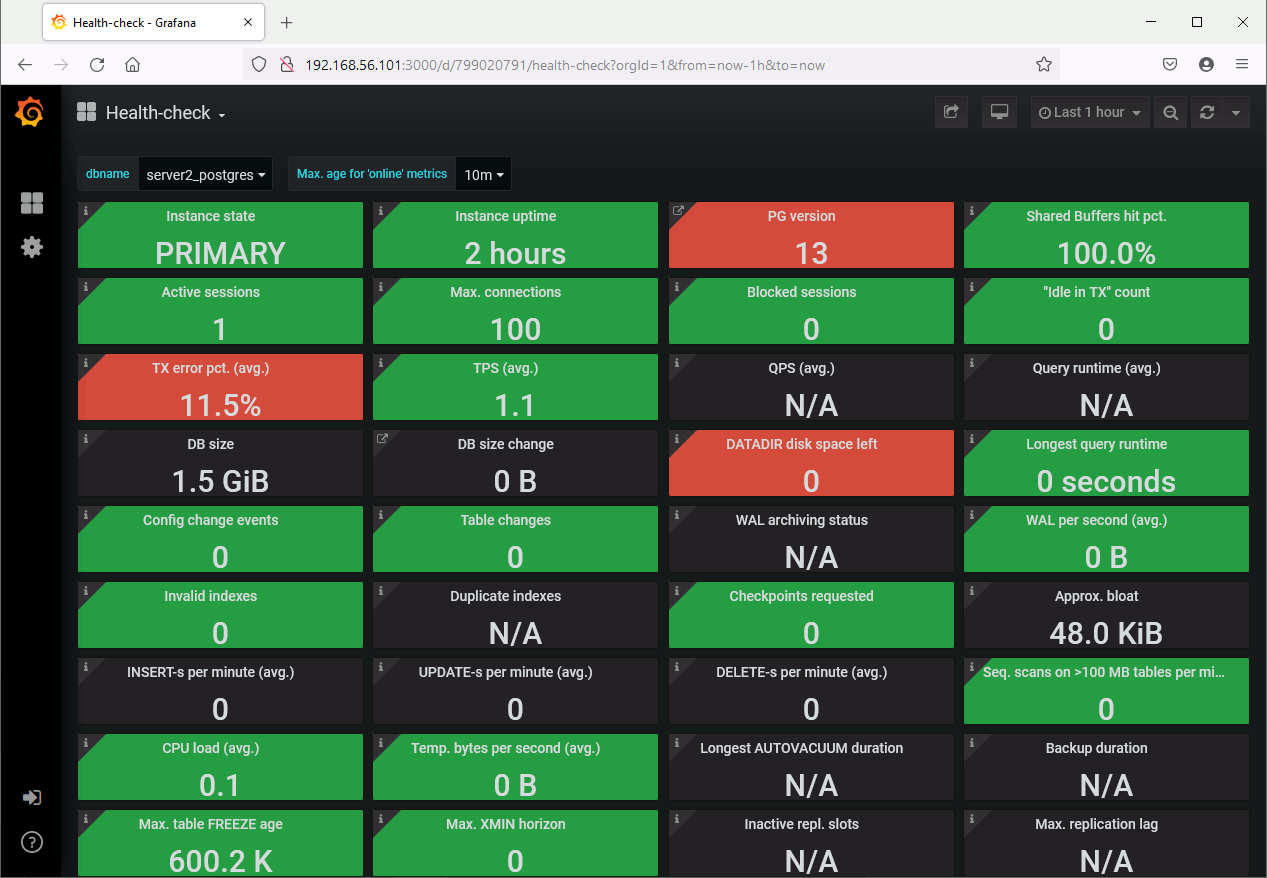
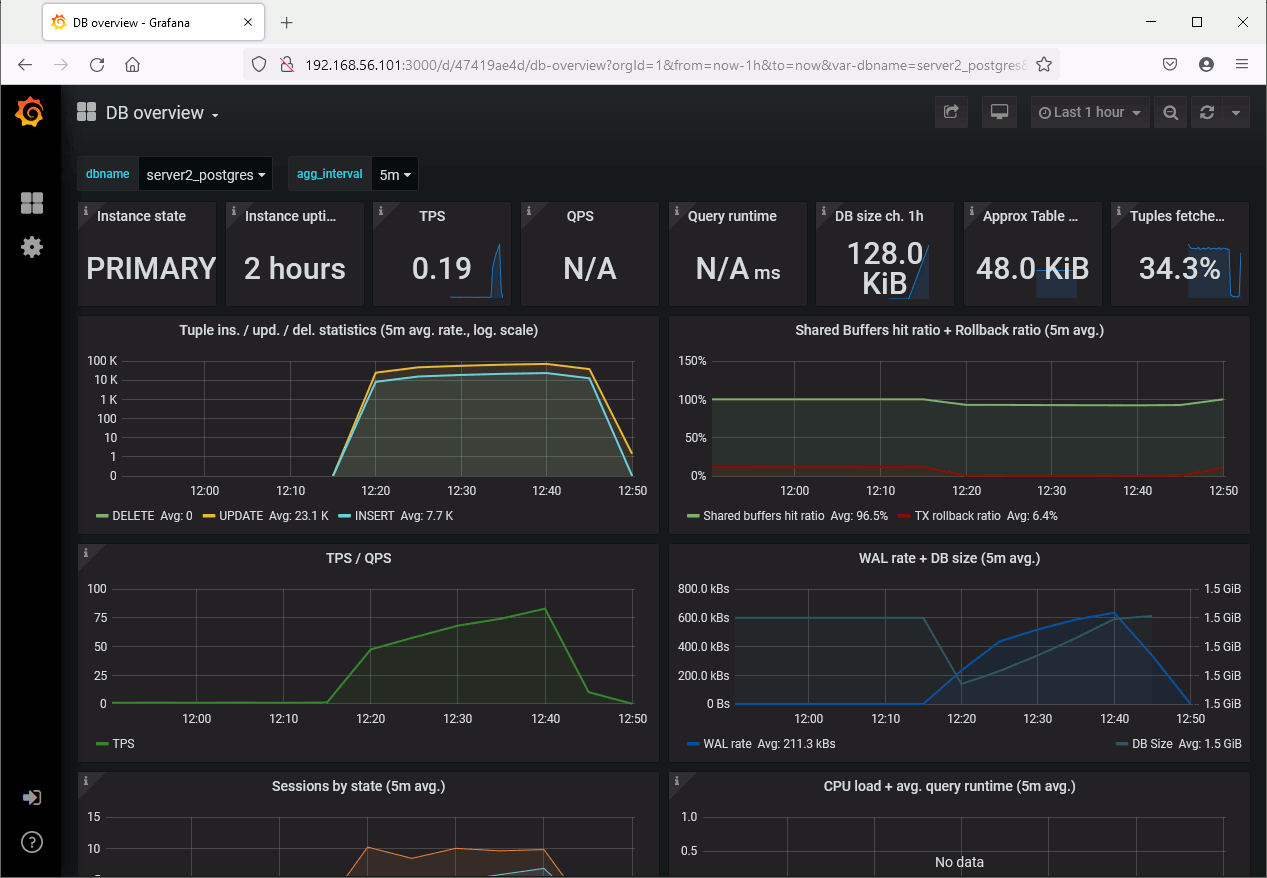

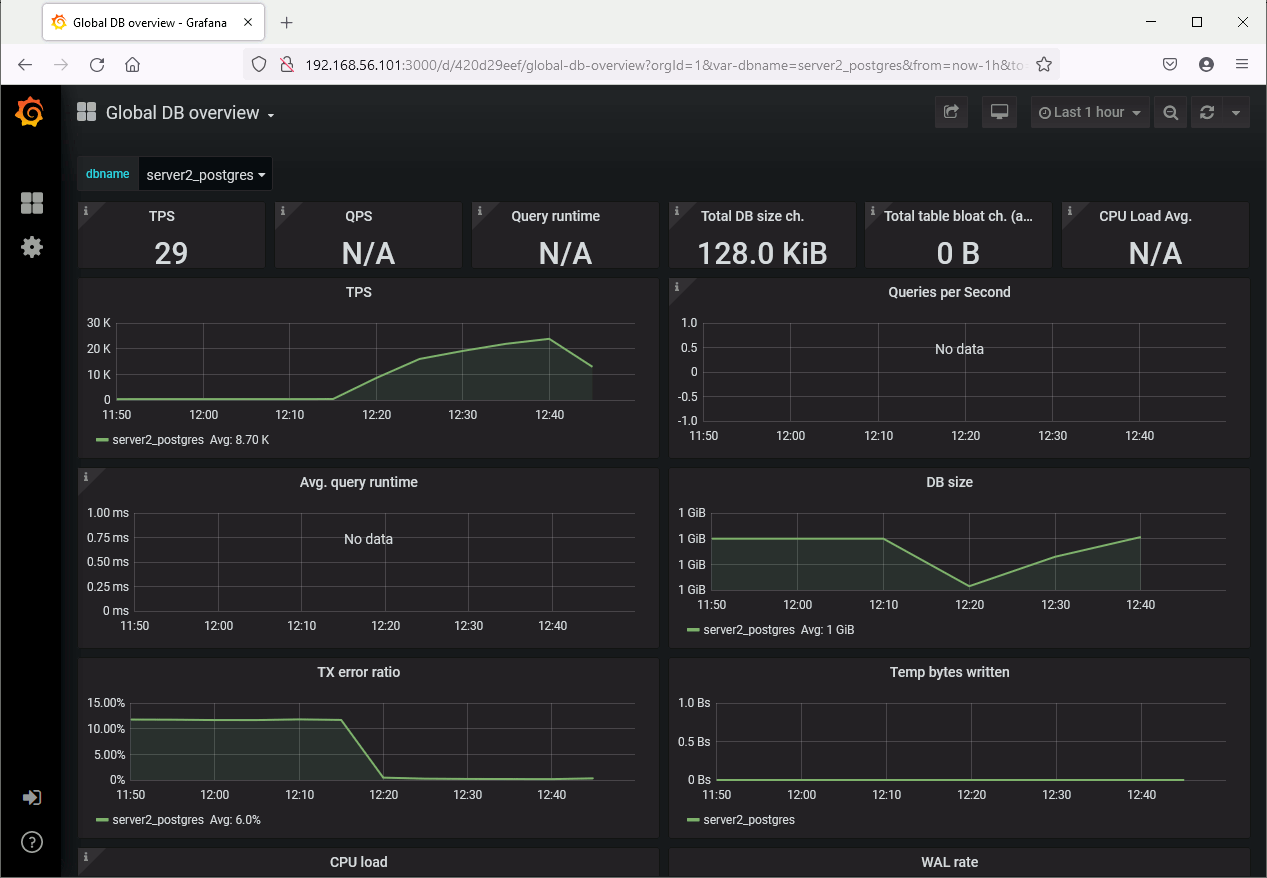
Again, as based on Grafana, the web UI is really really neat. Same as Percona’s product customization is limitless. The product is agentless (for good or bad) so even simplify installation. On top of this the product is free and open source: what can you ask more ?
To be continued…
List of potential interesting candidates:
References
- PostgreSQL WAL Retention and Clean Up: pg_archivecleanup
- Starting the Database Server
- Best Community Tools for PostgreSQL


 installation and usage")