We recently implemented LLAP in our Hadoop cluster. To do this as you can see in the Hortonworks configuration guideline we have dedicated a YARN queue 100% to run LLAP queries and this YARN queue dedicated to LLAP has a greater priority than the other YARN queues. The queue we have used was already existing and was used to perform business reporting queries.
We unfortunately have observed a bad side effect of this change. We had plenty of scripts (in Python mainly) connecting to Hive server directly and not specifying any queue. Those scripts were, also, not going through ZooKeeper and in any case not specifying the new JDBC Hive2 URL to connect to HiveServer2 Interactive i.e. LLAP. The (unexpected) result was multiple applications automatically allocated to LLAP queue in a non-LLAP mode so having NO resources available to be launched…
Solution at that stage is to kill them or try to move them to a different queue… Part of this can be done with Resource Manager UI but for fine modification like queue allocation or application priority you must use YARN command line !
The edition we have chosen is the Hortonworks one and we have installed release HDP-2.6.4.0.
Problematic situation and YARN command line first trial
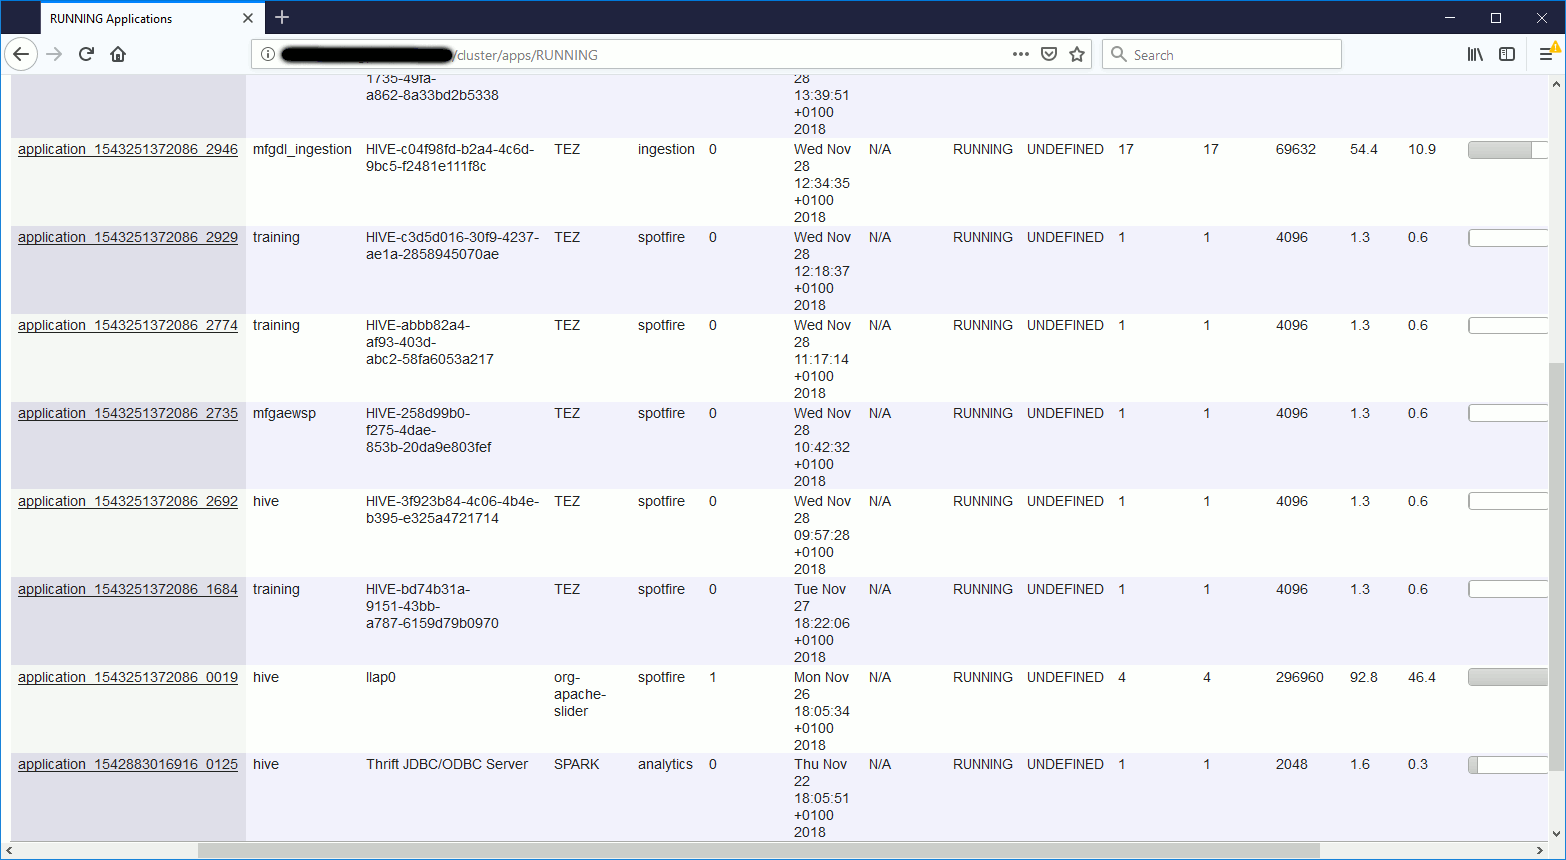
From Resource Manager UI we can see that many application are launched and have landed in the higher priority queue for LLAP (spotfire). I have started to suspect an issue because the applciation are waiting indefinitely. Application ID application_1543251372086_1684, for example, launched multiple hours ago (at the time of the screen shot) and completed at 0%:
yarn_command_line01
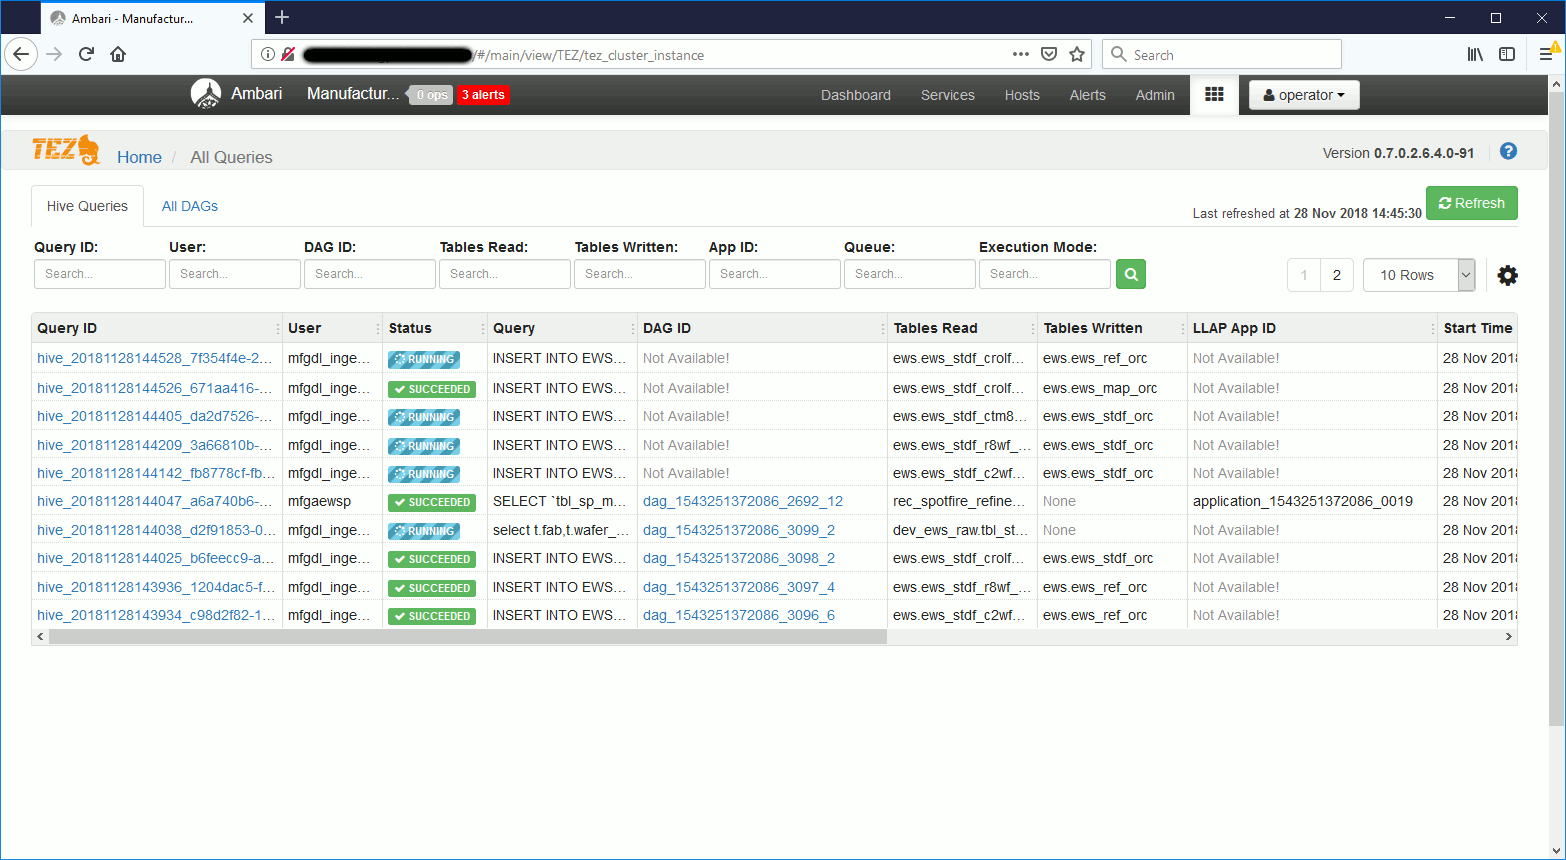
The running applications have no allocated resources and we don’t even see them in TEZ view:
yarn_command_line02
You can do (almost all) with Resource Manager UI but it’s always nice to have the YARN command line equivalence. If one day you like to developed few scripts to ease your life (the move queue below is also NOT accessible with graphical interface). YARN command line is also faster if you need to check status of multiple applications. Start by listing all applications, running and waiting to be run (ACCEPTED) with:
[yarn@mgmtserver ~]$ yarn application -list18/11/2814:43:04 INFO client.AHSProxy: Connecting to Application History server at masternode01.domain.com/192.168.1.1:1020018/11/2814:43:04 INFO client.RequestHedgingRMFailoverProxyProvider: Looking for the active RM in[rm1, rm2]...
18/11/2814:43:04 INFO client.RequestHedgingRMFailoverProxyProvider: Found active RM [rm2]
Total number of applications (application-types: [] and states: [SUBMITTED, ACCEPTED, RUNNING]):24
Application-Id Application-Name Application-Type User Queue State Final-State Progress Tracking-URL
application_1543251372086_1684 HIVE-bd74b31a-9151-43bb-a787-6159d79b0970 TEZ training spotfire RUNNING UNDEFINED 0% http://worker03.domain.com:40313/ui/
application_1543251372086_2692 HIVE-3f923b84-4c06-4b4e-b395-e325a4721714 TEZ hive spotfire RUNNING UNDEFINED 0% http://worker02.domain.com:34894/ui/
application_1543251372086_2735 HIVE-258d99b0-f275-4dae-853b-20da9e803fef TEZ mfgaewsp spotfire RUNNING UNDEFINED 0% http://worker01.domain.com:38295/ui/
application_1543251372086_2774 HIVE-abbb82a4-af93-403d-abc2-58fa6053a217 TEZ training spotfire RUNNING UNDEFINED 0% http://worker05.domain.com:39203/ui/
application_1543251372086_2929 HIVE-c3d5d016-30f9-4237-ae1a-2858945070ae TEZ training spotfire RUNNING UNDEFINED 0% http://worker04.domain.com:43126/ui/
application_1543251372086_2930 HIVE-37c2b156-43e2-43a5-86b5-fa96f29486cf TEZ training spotfire ACCEPTED UNDEFINED 0% N/A
application_1543251372086_2954 HIVE-de98d006-f1ee-43b6-9928-99c2b8338c2d TEZ mfgdl_ingestion spotfire ACCEPTED UNDEFINED 0% N/A
application_1543251372086_2955 HIVE-0ddab9a1-b335-4fd0-a717-db7ba5d7a6fd TEZ mfgdl_ingestion spotfire ACCEPTED UNDEFINED 0% N/A
application_1543251372086_2968 HIVE-ba458900-e9ee-48ad-b0a1-839be5208a81 TEZ training spotfire ACCEPTED UNDEFINED 0% N/A
application_1543251372086_2969 HIVE-e59da0bc-bf0b-428c-ad0c-3e262825bbc2 TEZ training spotfire ACCEPTED UNDEFINED 0% N/A
application_1543251372086_2967 HIVE-770714ee-8c6f-46b3-9374-b768b39b7f01 TEZ training spotfire ACCEPTED UNDEFINED 0% N/A
application_1543251372086_2952 HIVE-01e31000-829c-44b3-a0ff-7113c5864e86 TEZ mfgaewsp spotfire ACCEPTED UNDEFINED 0% N/A
application_1543251372086_2953 HIVE-b2089514-18e1-48e2-b8b1-85c48b407ab2 TEZ mfgaewsp spotfire ACCEPTED UNDEFINED 0% N/A
application_1543251372086_2946 HIVE-c04f98fd-b2a4-4c6d-9bc5-f2481e111f8c TEZ mfgdl_ingestion ingestion RUNNING UNDEFINED 0.91% http://worker01.domain.com:43019/ui/
application_1543251372086_2970 HIVE-a3fdd952-d5ed-424e-861c-7e0ac4572d37 TEZ training spotfire ACCEPTED UNDEFINED 0% N/A
application_1543251372086_2971 HIVE-8d10cc75-bdfb-4b41-aa2b-2771f401681e TEZ training spotfire ACCEPTED UNDEFINED 0% N/A
application_1543251372086_3025 HIVE-960aa95c-59f1-4f0f-9feb-6c615b8163cd TEZ mfgaewsp spotfire ACCEPTED UNDEFINED 0% N/A
application_1543251372086_3023 HIVE-17224232-ebc8-4a3b-bd78-c183840c521c TEZ mfgaewsp spotfire ACCEPTED UNDEFINED 0% N/A
application_1543251372086_3100 HIVE-d4aabb8b-b239-4b2e-8bcd-e16880114842 TEZ mfgdl_ingestion ingestion ACCEPTED UNDEFINED 0% N/A
application_1543251372086_3101 HIVE-9e63b3da-af08-40b0-8f74-4fd596089d51 TEZ mfgdl_ingestion ingestion ACCEPTED UNDEFINED 0% N/A
application_1543251372086_3098 HIVE-04686451-e693-45c7-9d79-038cffa25a80 TEZ mfgdl_ingestion ingestion ACCEPTED UNDEFINED 0% N/A
application_1543251372086_3099 HIVE-e12314df-8369-44c6-87cd-5b1c56b97a10 TEZ mfgdl_ingestion ingestion ACCEPTED UNDEFINED 0% N/A
application_1543251372086_0019 llap0 org-apache-slider hive spotfire RUNNING UNDEFINED 100% http://worker03.domain.com:39758
application_1542883016916_0125 Thrift JDBC/ODBC Server SPARK hive analytics RUNNING UNDEFINED 10% http://192.168.1.2:4040
[yarn@mgmtserver ~]$ yarn application -list
18/11/28 14:43:04 INFO client.AHSProxy: Connecting to Application History server at masternode01.domain.com/192.168.1.1:10200
18/11/28 14:43:04 INFO client.RequestHedgingRMFailoverProxyProvider: Looking for the active RM in [rm1, rm2]...
18/11/28 14:43:04 INFO client.RequestHedgingRMFailoverProxyProvider: Found active RM [rm2]
Total number of applications (application-types: [] and states: [SUBMITTED, ACCEPTED, RUNNING]):24
                Application-Id      Application-Name        Application-Type          User           Queue                   State             Final-State             Progress                        Tracking-URL
application_1543251372086_1684  HIVE-bd74b31a-9151-43bb-a787-6159d79b0970                        TEZ      training        spotfire                 RUNNING               UNDEFINED                   0% http://worker03.domain.com:40313/ui/
application_1543251372086_2692  HIVE-3f923b84-4c06-4b4e-b395-e325a4721714                        TEZ          hive        spotfire                 RUNNING               UNDEFINED                   0% http://worker02.domain.com:34894/ui/
application_1543251372086_2735  HIVE-258d99b0-f275-4dae-853b-20da9e803fef                        TEZ      mfgaewsp        spotfire                 RUNNING               UNDEFINED                   0% http://worker01.domain.com:38295/ui/
application_1543251372086_2774  HIVE-abbb82a4-af93-403d-abc2-58fa6053a217                        TEZ      training        spotfire                 RUNNING               UNDEFINED                   0% http://worker05.domain.com:39203/ui/
application_1543251372086_2929  HIVE-c3d5d016-30f9-4237-ae1a-2858945070ae                        TEZ      training        spotfire                 RUNNING               UNDEFINED                   0% http://worker04.domain.com:43126/ui/
application_1543251372086_2930  HIVE-37c2b156-43e2-43a5-86b5-fa96f29486cf                        TEZ      training        spotfire                ACCEPTED               UNDEFINED                   0%                                 N/A
application_1543251372086_2954  HIVE-de98d006-f1ee-43b6-9928-99c2b8338c2d                        TEZ    mfgdl_ingestion   spotfire                ACCEPTED               UNDEFINED                   0%                                 N/A
application_1543251372086_2955  HIVE-0ddab9a1-b335-4fd0-a717-db7ba5d7a6fd                        TEZ    mfgdl_ingestion   spotfire                ACCEPTED               UNDEFINED                   0%                                 N/A
application_1543251372086_2968  HIVE-ba458900-e9ee-48ad-b0a1-839be5208a81                        TEZ      training        spotfire                ACCEPTED               UNDEFINED                   0%                                 N/A
application_1543251372086_2969  HIVE-e59da0bc-bf0b-428c-ad0c-3e262825bbc2                        TEZ      training        spotfire                ACCEPTED               UNDEFINED                   0%                                 N/A
application_1543251372086_2967  HIVE-770714ee-8c6f-46b3-9374-b768b39b7f01                        TEZ      training        spotfire                ACCEPTED               UNDEFINED                   0%                                 N/A
application_1543251372086_2952  HIVE-01e31000-829c-44b3-a0ff-7113c5864e86                        TEZ      mfgaewsp        spotfire                ACCEPTED               UNDEFINED                   0%                                 N/A
application_1543251372086_2953  HIVE-b2089514-18e1-48e2-b8b1-85c48b407ab2                        TEZ      mfgaewsp        spotfire                ACCEPTED               UNDEFINED                   0%                                 N/A
application_1543251372086_2946  HIVE-c04f98fd-b2a4-4c6d-9bc5-f2481e111f8c                        TEZ    mfgdl_ingestion  ingestion                 RUNNING               UNDEFINED                0.91% http://worker01.domain.com:43019/ui/
application_1543251372086_2970  HIVE-a3fdd952-d5ed-424e-861c-7e0ac4572d37                        TEZ      training        spotfire                ACCEPTED               UNDEFINED                   0%                                 N/A
application_1543251372086_2971  HIVE-8d10cc75-bdfb-4b41-aa2b-2771f401681e                        TEZ      training        spotfire                ACCEPTED               UNDEFINED                   0%                                 N/A
application_1543251372086_3025  HIVE-960aa95c-59f1-4f0f-9feb-6c615b8163cd                        TEZ      mfgaewsp        spotfire                ACCEPTED               UNDEFINED                   0%                                 N/A
application_1543251372086_3023  HIVE-17224232-ebc8-4a3b-bd78-c183840c521c                        TEZ      mfgaewsp        spotfire                ACCEPTED               UNDEFINED                   0%                                 N/A
application_1543251372086_3100  HIVE-d4aabb8b-b239-4b2e-8bcd-e16880114842                        TEZ    mfgdl_ingestion  ingestion                ACCEPTED               UNDEFINED                   0%                                 N/A
application_1543251372086_3101  HIVE-9e63b3da-af08-40b0-8f74-4fd596089d51                        TEZ    mfgdl_ingestion  ingestion                ACCEPTED               UNDEFINED                   0%                                 N/A
application_1543251372086_3098  HIVE-04686451-e693-45c7-9d79-038cffa25a80                        TEZ    mfgdl_ingestion  ingestion                ACCEPTED               UNDEFINED                   0%                                 N/A
application_1543251372086_3099  HIVE-e12314df-8369-44c6-87cd-5b1c56b97a10                        TEZ    mfgdl_ingestion  ingestion                ACCEPTED               UNDEFINED                   0%                                 N/A
application_1543251372086_0019                 llap0       org-apache-slider          hive        spotfire                 RUNNING               UNDEFINED                 100%   http://worker03.domain.com:39758
application_1542883016916_0125  Thrift JDBC/ODBC Server                SPARK          hive       analytics                 RUNNING               UNDEFINED                  10%             http://192.168.1.2:4040
To have only the running ones:
[yarn@mgmtserver ~]$ yarn application -appStates RUNNING -list18/11/2817:15:27 INFO client.AHSProxy: Connecting to Application History server at masternode01.domain.com/192.168.1.1:1020018/11/2817:15:27 INFO client.RequestHedgingRMFailoverProxyProvider: Looking for the active RM in[rm1, rm2]...
18/11/2817:15:28 INFO client.RequestHedgingRMFailoverProxyProvider: Found active RM [rm2]
Total number of applications (application-types: [] and states: [RUNNING]):11
Application-Id Application-Name Application-Type User Queue State Final-State Progress Tracking-URL
application_1543251372086_1684 HIVE-bd74b31a-9151-43bb-a787-6159d79b0970 TEZ training spotfire RUNNING UNDEFINED 0% http://worker03.domain.com:40313/ui/
application_1543251372086_2692 HIVE-3f923b84-4c06-4b4e-b395-e325a4721714 TEZ hive spotfire RUNNING UNDEFINED 0% http://worker02.domain.com:34894/ui/
application_1543251372086_2735 HIVE-258d99b0-f275-4dae-853b-20da9e803fef TEZ mfgaewsp spotfire RUNNING UNDEFINED 0% http://worker01.domain.com:38295/ui/
application_1543251372086_2774 HIVE-abbb82a4-af93-403d-abc2-58fa6053a217 TEZ training spotfire RUNNING UNDEFINED 0% http://worker05.domain.com:39203/ui/
application_1543251372086_2929 HIVE-c3d5d016-30f9-4237-ae1a-2858945070ae TEZ training spotfire RUNNING UNDEFINED 0% http://worker04.domain.com:43126/ui/
application_1543251372086_2946 HIVE-c04f98fd-b2a4-4c6d-9bc5-f2481e111f8c TEZ mfgdl_ingestion ingestion RUNNING UNDEFINED 0.91% http://worker01.domain.com:43019/ui/
application_1543251372086_0019 llap0 org-apache-slider hive spotfire RUNNING UNDEFINED 100% http://worker03.domain.com:39758
application_1542883016916_0125 Thrift JDBC/ODBC Server SPARK hive analytics RUNNING UNDEFINED 10% http://192.168.1.2:4040
[yarn@mgmtserver ~]$ yarn application -appStates RUNNING -list
18/11/28 17:15:27 INFO client.AHSProxy: Connecting to Application History server at masternode01.domain.com/192.168.1.1:10200
18/11/28 17:15:27 INFO client.RequestHedgingRMFailoverProxyProvider: Looking for the active RM in [rm1, rm2]...
18/11/28 17:15:28 INFO client.RequestHedgingRMFailoverProxyProvider: Found active RM [rm2]
Total number of applications (application-types: [] and states: [RUNNING]):11
                Application-Id      Application-Name        Application-Type          User           Queue                   State             Final-State             Progress                        Tracking-URL
application_1543251372086_1684  HIVE-bd74b31a-9151-43bb-a787-6159d79b0970                        TEZ      training        spotfire                 RUNNING               UNDEFINED                   0% http://worker03.domain.com:40313/ui/
application_1543251372086_2692  HIVE-3f923b84-4c06-4b4e-b395-e325a4721714                        TEZ          hive        spotfire                 RUNNING               UNDEFINED                   0% http://worker02.domain.com:34894/ui/
application_1543251372086_2735  HIVE-258d99b0-f275-4dae-853b-20da9e803fef                        TEZ      mfgaewsp        spotfire                 RUNNING               UNDEFINED                   0% http://worker01.domain.com:38295/ui/
application_1543251372086_2774  HIVE-abbb82a4-af93-403d-abc2-58fa6053a217                        TEZ      training        spotfire                 RUNNING               UNDEFINED                   0% http://worker05.domain.com:39203/ui/
application_1543251372086_2929  HIVE-c3d5d016-30f9-4237-ae1a-2858945070ae                        TEZ      training        spotfire                 RUNNING               UNDEFINED                   0% http://worker04.domain.com:43126/ui/
application_1543251372086_2946  HIVE-c04f98fd-b2a4-4c6d-9bc5-f2481e111f8c                        TEZ    mfgdl_ingestion  ingestion                 RUNNING               UNDEFINED                0.91% http://worker01.domain.com:43019/ui/
application_1543251372086_0019                 llap0       org-apache-slider          hive        spotfire                 RUNNING               UNDEFINED                 100%   http://worker03.domain.com:39758
application_1542883016916_0125  Thrift JDBC/ODBC Server                SPARK          hive       analytics                 RUNNING               UNDEFINED                  10%             http://192.168.1.2:4040
If I take the LLAP process I get its application attempt with:
[yarn@mgmtserver ~]$ yarn applicationattempt -list application_1543251372086_0019
18/11/2817:30:39 INFO client.AHSProxy: Connecting to Application History server at masternode01.domain.com/192.168.1.1:1020018/11/2817:30:39 INFO client.RequestHedgingRMFailoverProxyProvider: Looking for the active RM in[rm1, rm2]...
18/11/2817:30:39 INFO client.RequestHedgingRMFailoverProxyProvider: Found active RM [rm2]
Total number of application attempts :1
ApplicationAttempt-Id State AM-Container-Id Tracking-URL
appattempt_1543251372086_0019_000001 RUNNING container_e185_1543251372086_0019_01_000001 http://masternode01.domain.com:8088/proxy/application_1543251372086_0019/
[yarn@mgmtserver ~]$ yarn applicationattempt -list application_1543251372086_0019
18/11/28 17:30:39 INFO client.AHSProxy: Connecting to Application History server at masternode01.domain.com/192.168.1.1:10200
18/11/28 17:30:39 INFO client.RequestHedgingRMFailoverProxyProvider: Looking for the active RM in [rm1, rm2]...
18/11/28 17:30:39 INFO client.RequestHedgingRMFailoverProxyProvider: Found active RM [rm2]
Total number of application attempts :1
         ApplicationAttempt-Id                 State                        AM-Container-Id                            Tracking-URL
appattempt_1543251372086_0019_000001                 RUNNING    container_e185_1543251372086_0019_01_000001     http://masternode01.domain.com:8088/proxy/application_1543251372086_0019/
And the list of (LLAP) containers with:
[yarn@mgmtserver ~]$ yarn container -list appattempt_1543251372086_0019_000001
18/11/2815:03:41 INFO client.AHSProxy: Connecting to Application History server at masternode01.domain.com/192.168.1.1:1020018/11/2815:03:41 INFO client.RequestHedgingRMFailoverProxyProvider: Looking for the active RM in[rm1, rm2]...
18/11/2815:03:41 INFO client.RequestHedgingRMFailoverProxyProvider: Found active RM [rm2]
Total number of containers :4
Container-Id Start Time Finish Time State Host Node Http Address LOG-URL
container_e185_1543251372086_0019_01_000001 Mon Nov 2618:05:35 +0100 2018 N/A RUNNING worker03.domain.com:45454 http://worker03.domain.com:8042 http://worker03.domain.com:8042/node/containerlogs/container_e185_1543251372086_0019_01_000001/hive
container_e185_1543251372086_0019_01_000005 Mon Nov 2618:05:41 +0100 2018 N/A RUNNING worker04.domain.com:45454 http://worker04.domain.com:8042 http://worker04.domain.com:8042/node/containerlogs/container_e185_1543251372086_0019_01_000005/hive
container_e185_1543251372086_0019_01_000002 Mon Nov 2618:05:40 +0100 2018 N/A RUNNING worker03.domain.com:45454 http://worker03.domain.com:8042 http://worker03.domain.com:8042/node/containerlogs/container_e185_1543251372086_0019_01_000002/hive
container_e185_1543251372086_0019_01_000003 Mon Nov 2618:05:40 +0100 2018 N/A RUNNING worker01.domain.com:45454 http://worker01.domain.com:8042 http://worker01.domain.com:8042/node/containerlogs/container_e185_1543251372086_0019_01_000003/hive
[yarn@mgmtserver ~]$ yarn container -list appattempt_1543251372086_0019_000001
18/11/28 15:03:41 INFO client.AHSProxy: Connecting to Application History server at masternode01.domain.com/192.168.1.1:10200
18/11/28 15:03:41 INFO client.RequestHedgingRMFailoverProxyProvider: Looking for the active RM in [rm1, rm2]...
18/11/28 15:03:41 INFO client.RequestHedgingRMFailoverProxyProvider: Found active RM [rm2]
Total number of containers :4
                  Container-Id            Start Time             Finish Time                   State                    Host       Node Http Address                                LOG-URL
container_e185_1543251372086_0019_01_000001     Mon Nov 26 18:05:35 +0100 2018                   N/A                 RUNNING    worker03.domain.com:45454      http://worker03.domain.com:8042        http://worker03.domain.com:8042/node/containerlogs/container_e185_1543251372086_0019_01_000001/hive
container_e185_1543251372086_0019_01_000005     Mon Nov 26 18:05:41 +0100 2018                   N/A                 RUNNING    worker04.domain.com:45454      http://worker04.domain.com:8042        http://worker04.domain.com:8042/node/containerlogs/container_e185_1543251372086_0019_01_000005/hive
container_e185_1543251372086_0019_01_000002     Mon Nov 26 18:05:40 +0100 2018                   N/A                 RUNNING    worker03.domain.com:45454      http://worker03.domain.com:8042        http://worker03.domain.com:8042/node/containerlogs/container_e185_1543251372086_0019_01_000002/hive
container_e185_1543251372086_0019_01_000003     Mon Nov 26 18:05:40 +0100 2018                   N/A                 RUNNING    worker01.domain.com:45454      http://worker01.domain.com:8042        http://worker01.domain.com:8042/node/containerlogs/container_e185_1543251372086_0019_01_000003/hive
At that stage it means that any application not using one of above containers is NOT using LLAP… Is it the case for the waiting indefinitely one we have seen above ?
YARN command line to the rescue
Get more details of a particular application with (one you suspect to be stuck):
[yarn@mgmtserver ~]$ yarn application -status application_1543251372086_1684
18/11/2814:52:22 INFO client.AHSProxy: Connecting to Application History server at masternode01.domain.com/192.168.1.1:1020018/11/2814:52:22 INFO client.RequestHedgingRMFailoverProxyProvider: Looking for the active RM in[rm1, rm2]...
18/11/2814:52:22 INFO client.RequestHedgingRMFailoverProxyProvider: Found active RM [rm2]
Application Report :
Application-Id : application_1543251372086_1684
Application-Name : HIVE-bd74b31a-9151-43bb-a787-6159d79b0970
Application-Type : TEZ
User : training
Queue : spotfire
Application Priority : null
Start-Time : 1543339326789
Finish-Time : 0
Progress : 0%
State : RUNNING
Final-State : UNDEFINED
Tracking-URL : http://worker03.domain.com:40313/ui/
RPC Port : 42387
AM Host : worker03.domain.com
Aggregate Resource Allocation : 61513551 MB-seconds, 15017 vcore-seconds
Log Aggregation Status : NOT_START
Diagnostics :
Unmanaged Application : false
Application Node Label Expression : <Not set>
AM container Node Label Expression : <DEFAULT_PARTITION>
[yarn@mgmtserver ~]$ yarn application -status application_1543251372086_1684
18/11/28 14:52:22 INFO client.AHSProxy: Connecting to Application History server at masternode01.domain.com/192.168.1.1:10200
18/11/28 14:52:22 INFO client.RequestHedgingRMFailoverProxyProvider: Looking for the active RM in [rm1, rm2]...
18/11/28 14:52:22 INFO client.RequestHedgingRMFailoverProxyProvider: Found active RM [rm2]
Application Report :
        Application-Id : application_1543251372086_1684
        Application-Name : HIVE-bd74b31a-9151-43bb-a787-6159d79b0970
        Application-Type : TEZ
        User : training
        Queue : spotfire
        Application Priority : null
        Start-Time : 1543339326789
        Finish-Time : 0
        Progress : 0%
        State : RUNNING
        Final-State : UNDEFINED
        Tracking-URL : http://worker03.domain.com:40313/ui/
        RPC Port : 42387
        AM Host : worker03.domain.com
        Aggregate Resource Allocation : 61513551 MB-seconds, 15017 vcore-seconds
        Log Aggregation Status : NOT_START
        Diagnostics :
        Unmanaged Application : false
        Application Node Label Expression : <Not set>
        AM container Node Label Expression : <DEFAULT_PARTITION>
Application is in state RUNNING, in YARN queue spotfire (LLAP) and progress status is 0%.
Get the application attempt (in order to get container list) with:
[yarn@mgmtserver ~]$ yarn applicationattempt -list application_1543251372086_1684
18/11/2814:53:41 INFO client.AHSProxy: Connecting to Application History server at masternode01.domain.com/192.168.1.1:1020018/11/2814:53:41 INFO client.RequestHedgingRMFailoverProxyProvider: Looking for the active RM in[rm1, rm2]...
18/11/2814:53:41 INFO client.RequestHedgingRMFailoverProxyProvider: Found active RM [rm2]
Total number of application attempts :1
ApplicationAttempt-Id State AM-Container-Id Tracking-URL
appattempt_1543251372086_1684_000001 RUNNING container_e185_1543251372086_1684_01_000001 http://masternode01.domain.com:8088/proxy/application_1543251372086_1684/
[yarn@mgmtserver ~]$ yarn applicationattempt -list application_1543251372086_1684
18/11/28 14:53:41 INFO client.AHSProxy: Connecting to Application History server at masternode01.domain.com/192.168.1.1:10200
18/11/28 14:53:41 INFO client.RequestHedgingRMFailoverProxyProvider: Looking for the active RM in [rm1, rm2]...
18/11/28 14:53:41 INFO client.RequestHedgingRMFailoverProxyProvider: Found active RM [rm2]
Total number of application attempts :1
         ApplicationAttempt-Id                 State                        AM-Container-Id                            Tracking-URL
appattempt_1543251372086_1684_000001                 RUNNING    container_e185_1543251372086_1684_01_000001     http://masternode01.domain.com:8088/proxy/application_1543251372086_1684/
Get container list with:
[yarn@mgmtserver ~]$ yarn container -list appattempt_1543251372086_1684_000001
18/11/2814:53:55 INFO client.AHSProxy: Connecting to Application History server at masternode01.domain.com/192.168.1.1:1020018/11/2814:53:55 INFO client.RequestHedgingRMFailoverProxyProvider: Looking for the active RM in[rm1, rm2]...
18/11/2814:53:55 INFO client.RequestHedgingRMFailoverProxyProvider: Found active RM [rm2]
Total number of containers :1
Container-Id Start Time Finish Time State Host Node Http Address LOG-URL
container_e185_1543251372086_1684_01_000001 Wed Nov 2810:42:02 +0100 2018 N/A RUNNING worker03.domain.com:45454 http://worker03.domain.com:8042 http://worker03.domain.com:8042/node/containerlogs/container_e185_1543251372086_1684_01_000001/training
[yarn@mgmtserver ~]$ yarn container -list appattempt_1543251372086_1684_000001
18/11/28 14:53:55 INFO client.AHSProxy: Connecting to Application History server at masternode01.domain.com/192.168.1.1:10200
18/11/28 14:53:55 INFO client.RequestHedgingRMFailoverProxyProvider: Looking for the active RM in [rm1, rm2]...
18/11/28 14:53:55 INFO client.RequestHedgingRMFailoverProxyProvider: Found active RM [rm2]
Total number of containers :1
                  Container-Id            Start Time             Finish Time                   State                    Host       Node Http Address                                LOG-URL
container_e185_1543251372086_1684_01_000001     Wed Nov 28 10:42:02 +0100 2018                   N/A                 RUNNING    worker03.domain.com:45454      http://worker03.domain.com:8042        http://worker03.domain.com:8042/node/containerlogs/container_e185_1543251372086_1684_01_000001/training
Here we see that this application is in spotfire queue and not running with one of the LLAP container so the issue…
Get the status of a container with:
[yarn@mgmtserver ~]$ yarn container -status container_e185_1543251372086_1684_01_000001
18/11/2814:54:25 INFO client.AHSProxy: Connecting to Application History server at masternode01.domain.com/192.168.1.1:1020018/11/2814:54:25 INFO client.RequestHedgingRMFailoverProxyProvider: Looking for the active RM in[rm1, rm2]...
18/11/2814:54:25 INFO client.RequestHedgingRMFailoverProxyProvider: Found active RM [rm2]
Container Report :
Container-Id : container_e185_1543251372086_1684_01_000001
Start-Time : 1543398122796
Finish-Time : 0
State : RUNNING
LOG-URL : http://worker03.domain.com:8042/node/containerlogs/container_e185_1543251372086_1684_01_000001/training
Host : worker03.domain.com:45454
NodeHttpAddress : http://worker03.domain.com:8042
Diagnostics : null
[yarn@mgmtserver ~]$ yarn container -status container_e185_1543251372086_1684_01_000001
18/11/28 14:54:25 INFO client.AHSProxy: Connecting to Application History server at masternode01.domain.com/192.168.1.1:10200
18/11/28 14:54:25 INFO client.RequestHedgingRMFailoverProxyProvider: Looking for the active RM in [rm1, rm2]...
18/11/28 14:54:25 INFO client.RequestHedgingRMFailoverProxyProvider: Found active RM [rm2]
Container Report :
        Container-Id : container_e185_1543251372086_1684_01_000001
        Start-Time : 1543398122796
        Finish-Time : 0
        State : RUNNING
        LOG-URL : http://worker03.domain.com:8042/node/containerlogs/container_e185_1543251372086_1684_01_000001/training
        Host : worker03.domain.com:45454
        NodeHttpAddress : http://worker03.domain.com:8042
        Diagnostics : null
Now you can decide to abruptly kill it with:
[yarn@mgmtserver ~]$ yarn application -kill application_1543251372086_1684
18/11/2817:50:51 INFO client.AHSProxy: Connecting to Application History server at masternode01.domain.com/192.168.1.1:1020018/11/2817:50:51 INFO client.RequestHedgingRMFailoverProxyProvider: Looking for the active RM in[rm1, rm2]...
18/11/2817:50:51 INFO client.RequestHedgingRMFailoverProxyProvider: Found active RM [rm2]
Killing application application_1543251372086_1684
18/11/2817:50:51 INFO impl.YarnClientImpl: Killed application application_1543251372086_1684
[yarn@mgmtserver ~]$ yarn application -kill application_1543251372086_1684
18/11/28 17:50:51 INFO client.AHSProxy: Connecting to Application History server at masternode01.domain.com/192.168.1.1:10200
18/11/28 17:50:51 INFO client.RequestHedgingRMFailoverProxyProvider: Looking for the active RM in [rm1, rm2]...
18/11/28 17:50:51 INFO client.RequestHedgingRMFailoverProxyProvider: Found active RM [rm2]
Killing application application_1543251372086_1684
18/11/28 17:50:51 INFO impl.YarnClientImpl: Killed application application_1543251372086_1684
Or to move it to a non-LLAP queue that have free resources with -movetoqueue option:
[yarn@mgmtserver ~]$ yarn application -queue analytics -movetoqueue application_1543251372086_1684
18/11/2815:05:53 INFO client.AHSProxy: Connecting to Application History server at masternode01.domain.com/192.168.1.1:1020018/11/2815:05:53 INFO client.RequestHedgingRMFailoverProxyProvider: Looking for the active RM in[rm1, rm2]...
18/11/2815:05:53 INFO client.RequestHedgingRMFailoverProxyProvider: Found active RM [rm2]
Moving application application_1543251372086_1684 to queue analytics
Successfully completed move.
[yarn@mgmtserver ~]$ yarn application -queue analytics -movetoqueue application_1543251372086_1684
18/11/28 15:05:53 INFO client.AHSProxy: Connecting to Application History server at masternode01.domain.com/192.168.1.1:10200
18/11/28 15:05:53 INFO client.RequestHedgingRMFailoverProxyProvider: Looking for the active RM in [rm1, rm2]...
18/11/28 15:05:53 INFO client.RequestHedgingRMFailoverProxyProvider: Found active RM [rm2]
Moving application application_1543251372086_1684 to queue analytics
Successfully completed move.
In above 1543339326789 is Tue Nov 27 18:22:06 +0100 2018. Which is almost 24 hours before I have taken the screen shot. Your can convert the timestamp in human readable date with many available web sites or directly in Bash with something like (man date for more information):
[yarn@mgmtserver ~]$ date--date='@1543339327' +'%c'
Tue 27 Nov 2018 06:22:07 PM CET
[yarn@mgmtserver ~]$ date --date='@1543339327' +'%c'
Tue 27 Nov 2018 06:22:07 PM CET
After a very short period I finally got below result (I wanted to go faster by changing application priority but my release is too old):
[yarn@mgmtserver ~]$ yarn application -status application_1543251372086_1684
18/11/2815:08:54 INFO client.AHSProxy: Connecting to Application History server at masternode01.domain.com/192.168.1.1:1020018/11/2815:08:54 INFO client.RequestHedgingRMFailoverProxyProvider: Looking for the active RM in[rm1, rm2]...
18/11/2815:08:54 INFO client.RequestHedgingRMFailoverProxyProvider: Found active RM [rm2]
Application Report :
Application-Id : application_1543251372086_1684
Application-Name : HIVE-bd74b31a-9151-43bb-a787-6159d79b0970
Application-Type : TEZ
User : training
Queue : analytics
Application Priority : null
Start-Time : 1543339326789
Finish-Time : 1543414091398
Progress : 100%
State : FINISHED
Final-State : SUCCEEDED
Tracking-URL : http://mgmtserver.domain.com:8080/#/main/view/TEZ/tez_cluster_instance?viewPath=%2F%23%2Ftez-app%2Fapplication_1543251372086_1684
RPC Port : 42387
AM Host : worker03.domain.com
Aggregate Resource Allocation : 67097515 MB-seconds, 16378 vcore-seconds
Log Aggregation Status : SUCCEEDED
Diagnostics : Session stats:submittedDAGs=1, successfulDAGs=1, failedDAGs=0, killedDAGs=0
Unmanaged Application : false
Application Node Label Expression : <Not set>
AM container Node Label Expression : <DEFAULT_PARTITION>
[yarn@mgmtserver ~]$ yarn application -status application_1543251372086_1684
18/11/28 15:08:54 INFO client.AHSProxy: Connecting to Application History server at masternode01.domain.com/192.168.1.1:10200
18/11/28 15:08:54 INFO client.RequestHedgingRMFailoverProxyProvider: Looking for the active RM in [rm1, rm2]...
18/11/28 15:08:54 INFO client.RequestHedgingRMFailoverProxyProvider: Found active RM [rm2]
Application Report :
Application-Id : application_1543251372086_1684
Application-Name : HIVE-bd74b31a-9151-43bb-a787-6159d79b0970
Application-Type : TEZ
User : training
Queue : analytics
Application Priority : null
Start-Time : 1543339326789
Finish-Time : 1543414091398
Progress : 100%
State : FINISHED
Final-State : SUCCEEDED
Tracking-URL : http://mgmtserver.domain.com:8080/#/main/view/TEZ/tez_cluster_instance?viewPath=%2F%23%2Ftez-app%2Fapplication_1543251372086_1684
RPC Port : 42387
AM Host : worker03.domain.com
Aggregate Resource Allocation : 67097515 MB-seconds, 16378 vcore-seconds
Log Aggregation Status : SUCCEEDED
Diagnostics : Session stats:submittedDAGs=1, successfulDAGs=1, failedDAGs=0, killedDAGs=0Unmanaged Application : false
Application Node Label Expression : <Not set>
AM container Node Label Expression : <DEFAULT_PARTITION>
One cool command to get the log of your application is: