Table of contents
Preamble
Resource Governor is a SQL Server feature to control system resources consumption by your users. What you can control currently is:
- CPU
- I/O
- Memory
- Degree Of Parallelism (DOP)
- Maximum number of sessions
This is the equivalent feature of Database Resource Manager (DBRM) for Oracle.
Disclaimer:
Testing this feature has been an endless ping pong with Microsoft support and even at the end I have decided to give up not to waste too much time on it. The CPU usage figures are really difficult to understand and it is almost impossible to do the math and understand the used CPU versus what you have set at resource pool level.
What I clearly plan to test is restricting CPU usage on a database server as it is often the resource you would like to control amongst your reporting users.
After long discussion with Microsoft my test server is finally running under Virtual Box with Ubuntu 20.04.6 LTS (Focal Fossa). This is the OS Microsoft is using internally to do testing with customers. I have allocated 4 CPUs (thread in fact) to this VM and 4GB of memory.
I have installed Microsoft SQL Server 2022 (16.0.4075.1-1) Developer Edition (64-bit).
Resource Governor pre-requisites
For test case I create a test database:
create database testdb containment = none on primary (name = N'testdb', filename = N'/mssql/data/testdb.mdf' , size = 10240KB , maxsize = 102400KB , filegrowth = 5120KB ) log on ( name = N'testdb_log', filename = N'/mssql/log/testdb_log.ldf' , size = 10240KB , maxsize = 102400KB , filegrowth = 5120KB ) |
And a few test users:
use master go create login usecase01 with password=N'secure_password', default_database=testdb, check_policy=off go use testdb go create user usecase01 for login usecase01 go grant create table to usecase01 go alter user usecase01 with default_schema=usecase01 go create schema usecase01 authorization usecase01 go use master go create login usecase02 with password=N'secure_password', default_database=testdb, check_policy=off go use testdb go create user usecase02 for login usecase02 go grant create table to usecase02 go alter user usecase02 with default_schema=usecase02 go create schema usecase02 authorization usecase02 go |
In each schema I create a test table:
create table test01(id integer, descr varchar(20)) go insert into test01 values(1,'One') go |
To avoid typing password each time I export below variable (never ever do this in any of your applications, for testing purpose only):
mssql@ubuntu01:~$ export SQLCMDPASSWORD=secure_password |
Here I have a perfect segregation of the user and their objects:
mssql@ubuntu01:~$ sqlcmd -S ubuntu01.domain.com:1443 -U usecase01 1> select * from usecase01.test01 2> go id descr ----------- -------------------- 1 One (1 row affected) 1> select * from usecase02.test01 2> go Msg 229, Level 14, State 5, Server ubuntu01, Line 1 The SELECT permission was denied on the object 'test01', database 'testdb', schema 'usecase02'. |
To generate some CPU I have written below SQL code and shell script to execute it (the SQL command does not generate any parallel process so ease the follow-up):
mssql@ubuntu01:~$ cat eat_cpu.sql declare @t datetime, @f bigint; set @t = getdate(); while dateadd(second,120,@t)>getdate() set @f=power(2,30); mssql@ubuntu01:~$ cat eat_cpu sqlcmd -S ubuntu01.domain.com:1443 -U usecase01 -i eat_cpu.sql |
To execute multiple session in parallel you can do something like:
mssql@ubuntu01:~$ for i in {1..4}; do nohup ./eat_cpu & done |
Without Resource Governor it should just take 100% of your server CPU:
Remark:
For CPU usage reporting you can simply use top or the excellent nmon.
The SQL Server database process is taking it’s slice of pie as well:
PID USER PR NI VIRT RES SHR S %CPU %MEM TIME+ COMMAND 2035 mssql 20 0 5672400 958568 89152 S 132.3 25.8 14:56.19 sqlservr 12094 mssql 20 0 722732 39132 14852 S 61.4 1.1 0:16.86 sqlcmd 12095 mssql 20 0 722732 38932 14980 S 61.1 1.0 0:16.39 sqlcmd 12092 mssql 20 0 722988 34472 14324 S 58.7 0.9 0:16.62 sqlcmd 12093 mssql 20 0 722732 35408 14200 S 58.7 1.0 0:17.24 sqlcmd |
But we see that all processes go till we reach 100% CPU usage…
Resource Governor configuration
Activate the resource governor with SQL Server Management Studio (SSMS):

Or with TSQL command:
use master go alter resource governor reconfigure go |
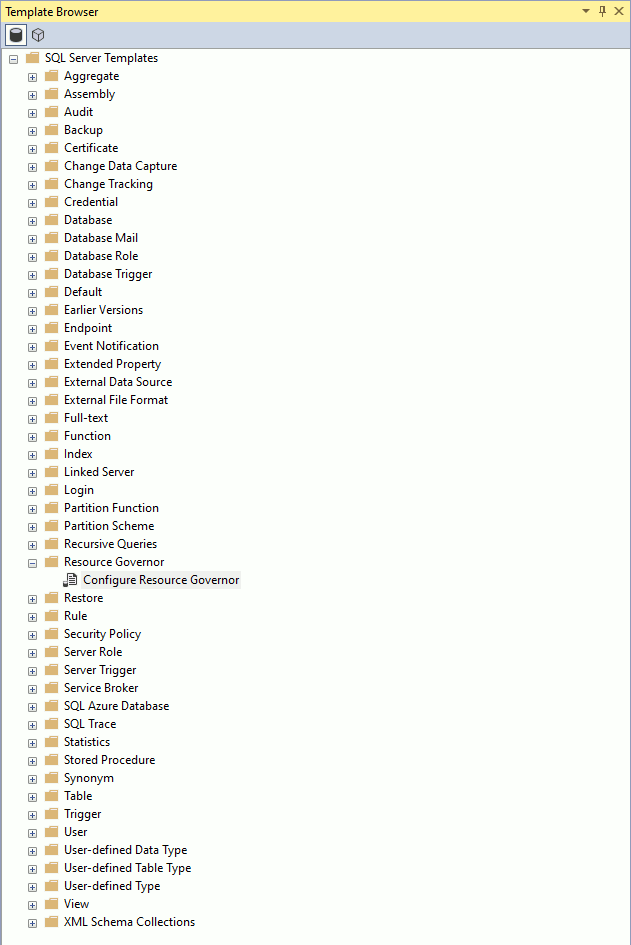
To configure it you can start with a template using View/Template Explorer menu in SSMS and obviously choose Resource Governor:
Or create on your own resource pool with TSQL:
use master go create resource pool usecase01_rp with ( min_cpu_percent = 0, max_cpu_percent = 10, cap_cpu_percent = 10 ) go |
Here I have decided to limit the CPU usage to 10% with CAP_CPU_PERCENT. Worth noting that MAX_CPU_PERCENT has no effect when your server is not overloaded. In other words MAX_CPU_PERCENT has an impact only when there is CPU contention.
You also need a workload group in your resource pool. You might have as many as you want:
use master go create workload group usecase01_wg with ( importance = medium, group_max_requests=6 ) using usecase01_rp go alter resource governor reconfigure go |
Here I have limited the number of session to 6 and set the importance of this workload group to medium (default). As the cap_cpu_percent is per session in my opinion you must also limit the number of session or the CPU usage could explode if users are submitting plenty of sessions…
You also need a classifier function. The one I have decided to create is obviously on the login name that got redirected to its corresponding workload group (and so resource pool). The grant on execute to public is only for testing purpose:
use master go alter resource governor with (classifier_function = NULL) go alter resource governor reconfigure go create or alter function fnLoginClassifier() returns sysname with schemabinding as begin /* We recommend running the classifier function code under snapshot isolation level OR using NOLOCK hint to avoid blocking on lookup table. In this example, we are using NOLOCK hint. */ declare @login sysname set @login = original_login() if (@login in ('usecase01','usecase02')) begin return @login + '_wg' end return N'default' end go grant execute on dbo.fnLoginClassifier to public go alter resource governor with (classifier_function = dbo.fnLoginClassifier) go alter resource governor reconfigure go |
Resource Governor testing
To know if each session is going to the right workload group you can use below query:
select s.group_id, cast(g.name as nvarchar(20)) as wg, s.session_id, s.login_name, s.login_time, cast(s.host_name as nvarchar(20)) as host_name, cast(s.program_name as nvarchar(20)) as program_name from sys.dm_exec_sessions as s inner join sys.dm_resource_governor_workload_groups as g on g.group_id = s.group_id where s.login_name like 'use%' order by g.group_id desc, s.session_id |
Can be also tested per account with something like:
mssql@ubuntu01:~$ sqlcmd -S ubuntu01.domain.com:1443 -U usecase01 1> use master 2> go Changed database context to 'master'. 1> select dbo.fnLoginClassifier(); 2> go -------------------------------------------------------------------------------------------------------------------------------- usecase01_wg (1 row affected) |
I have executed same as above 4 sessions (it would ease the computation with a 4 CPU VM) with:
mssql@ubuntu01:~$ for i in {1..4}; do nohup ./eat_cpu & done |
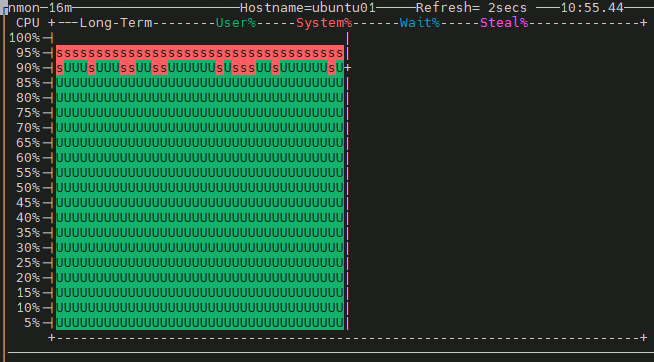
Then looking at CPU resource consumption I have to say that it is far to be correct and really erratic. I have 4 sessions running on a 4 cores server so each session should consume 10% as expected:
PID USER PR NI VIRT RES SHR S %CPU %MEM TIME+ COMMAND 1039 mssql 20 0 5504144 832464 88360 S 43.5 20.7 34:59.03 sqlservr 12261 mssql 20 0 722468 28536 14896 S 21.9 0.7 0:03.30 sqlcmd 12259 mssql 20 0 722724 27288 13992 S 20.6 0.7 0:03.30 sqlcmd 12262 mssql 20 0 722468 27828 14768 S 20.3 0.7 0:03.38 sqlcmd 12260 mssql 20 0 722724 27364 14140 S 18.9 0.7 0:03.33 sqlcmd |
With nmon:

If I try to execute 8 sessions with:
mssql@ubuntu01:~$ for i in {1..8}; do nohup ./eat_cpu & done |
Then only 6 are actually scheduled and this time their individual consumption looks closer to what’s expected:
PID USER PR NI VIRT RES SHR S %CPU %MEM TIME+ COMMAND 13982 mssql 20 0 5301876 646876 78152 S 43.6 16.1 0:29.02 sqlservr 14237 mssql 20 0 722468 27448 14248 S 19.1 0.7 0:04.58 sqlcmd 14231 mssql 20 0 722468 28384 14768 S 17.8 0.7 0:04.60 sqlcmd 14242 mssql 20 0 722724 28980 15084 S 11.2 0.7 0:02.66 sqlcmd 14232 mssql 20 0 722724 30164 15064 S 10.2 0.8 0:02.67 sqlcmd 14238 mssql 20 0 722724 27512 14704 S 10.2 0.7 0:02.53 sqlcmd 14233 mssql 20 0 722724 28328 14944 S 8.6 0.7 0:02.51 sqlcmd |
If I schedule only one session the CPU usage goes to more than 70% of a single CPU:
PID USER PR NI VIRT RES SHR S %CPU %MEM TIME+ COMMAND 14369 mssql 20 0 722724 28008 14836 S 73.8 0.7 0:10.92 sqlcmd 13982 mssql 20 0 5463036 803304 85928 S 38.9 20.0 2:32.26 sqlservr |
Whatever CPU cap I’m using I failed to understand the link with the limit of each session. They are limited for sure but I have not been able to extract the rule. I tend to conclude that the feature is not working on Linux and even Microsoft support has not been able to explain me the reason… In the official documentation there is a warning:
Due to the statistical nature of CPU governance, you may notice occasional spikes exceeding the value specified in CAP_CPU_PERCENT.
For sure I see spikes…
Resource Governor to go further
You can reconfigure the CPU max and cap with something like (reset statistics is to clean past figures in below performance tables):
use master go alter resource pool usecase01_rp with ( max_cpu_percent=10, cap_cpu_percent = 10 ) go alter resource governor reconfigure go alter resource governor reset statistics go |
And fine control what’s used and what’s delayed preempted with (the group_id and pool_id is only for me, update for your case or just remove the where clause):
select * from sys.dm_resource_governor_workload_groups where group_id=256 select * from sys.dm_resource_governor_resource_pools where pool_id=256 |


Tomasz Ziss says:
Thanks for very nice article. I always knew Oracle Resource Manager is not perfect, but I this Resource Governor is quite crazy.
Yannick Jaquier says:
Thanks for comment ! And as specified in blog post the time I have spent with Microsoft support is quite crazy. I hope someone that made it working on Windows will stop by and throw some light for us…