Table of contents
Preamble
Following a performance issue we had on a BI environment we have extracted with Automatic Workload Repository (AWR) reports few SQLs that are running for tens of minutes not to say multiple hours. Before the mess started we had an hardware storage issue (I/O switches) which triggered additional I/Os to recover situation. In parallel applicative team that got no feedback about the situation that was under recover started to reorganize tables to try to reduce High Water Mark and increase performance. Overall the benefit was the opposite because when storage issues were completely resolved we did not get the exact performance before it all started.
The big question you must answer is: how was it behaving before the issue and do those SQLs had their execution time changed ?
Ideally you would need to have a baseline when performance were good and you would be able to compare, as we have already seen in this blog post. Another option is to use AWR tables and mine into them to try to compare how SQLs have diverged over time. For this obviously you need historical AWR snapshots so the must to keep at least 15 days of history (not to say one month) and change the too low default 7 days value. Example with 1 hour snapshot and 30 days history:
SQL> EXEC dbms_workload_repository.modify_snapshot_settings (INTERVAL=>60, retention=>43200); PL/SQL PROCEDURE successfully completed. |
Checking which SQLs diverge is also overall a very interesting information and can trigger nice discover in your batch jobs scheduling (too early, too late,…) and/or jobs running in parallel even if you are not stuck in a performance issue situation.
So far testing has been done on Oracle Enterprise Edition 11.2.0.4 with Tuning and Diagnostic packs running on RedHat Linux release 6.4 64 bits. I will complement this post on other releases and operating system in future…
Parallel downgrades
If you are using Cloud Control one thing you have surely noticed (thanks to the red arrow) in SQL Monitoring page is the decrease in allocated parallel processes if your server is overloaded or sessions are exaggeratedly using parallelism:

This can also be seen at SQL level with something like:
SQL> SET lines 150 pages 1000 SQL> SELECT sql_id, sql_exec_id, TO_CHAR(sql_exec_start,'dd-mon-yyyy hh24:mi:ss') AS sql_exec_start, ROUND(elapsed_time/1000000) AS "Elapsed(s)", px_servers_requested AS "Requested DOP", px_servers_allocated AS "Allocated DOP", ROUND(cpu_time/1000000) AS "CPU(s)", buffer_gets AS "Buffer Gets", ROUND(physical_read_bytes /(1024*1024)) AS "Phys reads(MB)", ROUND(physical_write_bytes/(1024*1024)) AS "Phys writes(MB)", ROUND(user_io_wait_time/1000000) AS "IO Wait(s)" FROM v$sql_monitor WHERE px_servers_requested<>px_servers_allocated ORDER BY sql_exec_start,sql_id; SQL_ID SQL_EXEC_ID SQL_EXEC_START Elapsed(s) Requested DOP Allocated DOP CPU(s) Buffer Gets Phys reads(MB) Phys writes(MB) IO Wait(s) ------------- ----------- -------------------- ---------- ------------- ------------- ---------- ----------- -------------- --------------- ---------- 262dzg4ab75nt 16777216 02-dec-2016 15:22:34 263 32 0 10 511923 3625 810 250 883v5mk5bqwq8 16777216 02-dec-2016 15:23:43 41 64 14 8 156832 1426 0 27 7rykdg0zdyjz5 16777216 02-dec-2016 15:24:16 159 32 0 9 560335 802 856 151 amzmxuns5dctz 16777216 02-dec-2016 15:24:59 114 32 0 5 36383 569 548 108 414x9b7p4z10x 16777280 02-dec-2016 15:26:30 0 16 14 0 5 0 0 0 414x9b7p4z10x 16777281 02-dec-2016 15:26:31 0 16 10 0 5 0 0 0 414x9b7p4z10x 16777282 02-dec-2016 15:26:31 0 16 14 0 5 0 0 0 3472f0m6nm343 16778004 02-dec-2016 15:26:33 0 32 14 0 381 0 0 0 414x9b7p4z10x 16777283 02-dec-2016 15:26:35 0 16 14 0 5 0 0 0 3472f0m6nm343 16778005 02-dec-2016 15:26:40 0 32 14 0 381 0 0 0 3472f0m6nm343 16778006 02-dec-2016 15:26:46 0 32 14 0 381 0 0 0 11 ROWS selected. |
Problem is that V$SQL_MONITORING has no history version so if you come late onto database you will not be able to get any past information about it…
What you can have is overall parallel situation of your database with:
SQL> SET lines 150 pages 1000 SQL> SELECT name, VALUE FROM V$SYSSTAT WHERE LOWER(name) LIKE '%parallel%' ORDER BY 1; NAME VALUE ---------------------------------------------------------------- ---------- DBWR parallel query checkpoint buffers written 1132544 DDL statements parallelized 1864 DFO trees parallelized 295265 DML statements parallelized 21 Parallel operations downgraded 1 TO 25 pct 55785 Parallel operations downgraded 25 TO 50 pct 12427 Parallel operations downgraded 50 TO 75 pct 78033 Parallel operations downgraded 75 TO 99 pct 8125 Parallel operations downgraded TO serial 150542 Parallel operations NOT downgraded 241815 queries parallelized 208744 11 ROWS selected. |
As this table has no historical equivalent you can have values for each AWR snapshot:
SQL> SET lines 150 pages 1000 SQL> SELECT TO_CHAR(hsn.begin_interval_time,'dd-mon-yyyy hh24:mi:ss') AS begin_interval_time, TO_CHAR(hsn.end_interval_time,'dd-mon-yyyy hh24:mi:ss') AS end_interval_time, hsy.stat_name, hsy.VALUE FROM dba_hist_sysstat hsy, dba_hist_snapshot hsn WHERE hsy.snap_id = hsn.snap_id AND hsy.instance_number = hsn.instance_number AND LOWER(hsy.stat_name) LIKE '%parallel%' ORDER BY hsn.snap_id DESC; BEGIN_INTERVAL_TIME END_INTERVAL_TIME STAT_NAME VALUE -------------------- -------------------- ---------------------------------------------------------------- ---------- 30-nov-2016 23:00:18 01-dec-2016 00:00:48 queries parallelized 182440 30-nov-2016 23:00:18 01-dec-2016 00:00:48 Parallel operations downgraded 25 TO 50 pct 10602 30-nov-2016 23:00:18 01-dec-2016 00:00:48 Parallel operations downgraded 1 TO 25 pct 48914 30-nov-2016 23:00:18 01-dec-2016 00:00:48 DML statements parallelized 17 30-nov-2016 23:00:18 01-dec-2016 00:00:48 DDL statements parallelized 1376 30-nov-2016 23:00:18 01-dec-2016 00:00:48 Parallel operations downgraded 50 TO 75 pct 56565 30-nov-2016 23:00:18 01-dec-2016 00:00:48 Parallel operations downgraded 75 TO 99 pct 7782 30-nov-2016 23:00:18 01-dec-2016 00:00:48 DBWR parallel query checkpoint buffers written 936382 30-nov-2016 23:00:18 01-dec-2016 00:00:48 Parallel operations NOT downgraded 225266 30-nov-2016 23:00:18 01-dec-2016 00:00:48 DFO trees parallelized 248642 30-nov-2016 23:00:18 01-dec-2016 00:00:48 Parallel operations downgraded TO serial 117995 30-nov-2016 22:00:52 30-nov-2016 23:00:18 Parallel operations downgraded 50 TO 75 pct 56500 30-nov-2016 22:00:52 30-nov-2016 23:00:18 DFO trees parallelized 248352 30-nov-2016 22:00:52 30-nov-2016 23:00:18 Parallel operations NOT downgraded 225118 30-nov-2016 22:00:52 30-nov-2016 23:00:18 DBWR parallel query checkpoint buffers written 919901 30-nov-2016 22:00:52 30-nov-2016 23:00:18 Parallel operations downgraded 75 TO 99 pct 7780 30-nov-2016 22:00:52 30-nov-2016 23:00:18 Parallel operations downgraded 25 TO 50 pct 10542 30-nov-2016 22:00:52 30-nov-2016 23:00:18 Parallel operations downgraded 1 TO 25 pct 48899 30-nov-2016 22:00:52 30-nov-2016 23:00:18 DML statements parallelized 17 30-nov-2016 22:00:52 30-nov-2016 23:00:18 queries parallelized 182170 30-nov-2016 22:00:52 30-nov-2016 23:00:18 Parallel operations downgraded TO serial 117847 30-nov-2016 22:00:52 30-nov-2016 23:00:18 DDL statements parallelized 1356 . |
With LAG analytic function you might even get the trend of one particular system statistics. I have chosen Parallel operations downgraded to serial means all queries that have moved from parallel to serial. On some you might expect a big performance penalty:
SQL> SET lines 150 pages 1000 SQL> SELECT TO_CHAR(hsn.begin_interval_time,'dd-mon-yyyy hh24:mi:ss') AS begin_interval_time, TO_CHAR(hsn.end_interval_time,'dd-mon-yyyy hh24:mi:ss') AS end_interval_time, hsy.stat_name, hsy.VALUE - hsy.prev_value AS VALUE FROM (SELECT snap_id,instance_number,stat_name,VALUE,LAG(VALUE,1,VALUE) OVER (ORDER BY snap_id) AS prev_value FROM dba_hist_sysstat WHERE stat_name = 'Parallel operations downgraded to serial') hsy, dba_hist_snapshot hsn WHERE hsy.snap_id = hsn.snap_id AND hsy.instance_number = hsn.instance_number AND hsy.VALUE - hsy.prev_value<>0 ORDER BY hsn.snap_id DESC; BEGIN_INTERVAL_TIME END_INTERVAL_TIME STAT_NAME VALUE -------------------- -------------------- ---------------------------------------------------------------- ---------- 30-nov-2016 23:00:18 01-dec-2016 00:00:48 Parallel operations downgraded TO serial 148 30-nov-2016 22:00:52 30-nov-2016 23:00:18 Parallel operations downgraded TO serial 264 30-nov-2016 21:00:15 30-nov-2016 22:00:52 Parallel operations downgraded TO serial 160 30-nov-2016 20:00:42 30-nov-2016 21:00:15 Parallel operations downgraded TO serial 65 30-nov-2016 19:00:25 30-nov-2016 20:00:42 Parallel operations downgraded TO serial 31 30-nov-2016 18:00:29 30-nov-2016 19:00:25 Parallel operations downgraded TO serial 8 30-nov-2016 17:00:57 30-nov-2016 18:00:29 Parallel operations downgraded TO serial 1789 30-nov-2016 16:00:11 30-nov-2016 17:00:57 Parallel operations downgraded TO serial 588 30-nov-2016 15:00:37 30-nov-2016 16:00:11 Parallel operations downgraded TO serial 1214 30-nov-2016 14:01:07 30-nov-2016 15:00:37 Parallel operations downgraded TO serial 856 30-nov-2016 09:00:24 30-nov-2016 10:00:26 Parallel operations downgraded TO serial 603 30-nov-2016 07:00:03 30-nov-2016 08:00:22 Parallel operations downgraded TO serial 6 30-nov-2016 06:00:42 30-nov-2016 07:00:03 Parallel operations downgraded TO serial 502 30-nov-2016 05:00:24 30-nov-2016 06:00:42 Parallel operations downgraded TO serial 8 30-nov-2016 04:00:04 30-nov-2016 05:00:24 Parallel operations downgraded TO serial 3032 30-nov-2016 03:00:37 30-nov-2016 04:00:04 Parallel operations downgraded TO serial 1161 30-nov-2016 02:00:39 30-nov-2016 03:00:37 Parallel operations downgraded TO serial 1243 30-nov-2016 01:01:04 30-nov-2016 02:00:39 Parallel operations downgraded TO serial 492 30-nov-2016 00:01:05 30-nov-2016 01:01:04 Parallel operations downgraded TO serial 51 29-nov-2016 23:00:00 30-nov-2016 00:01:05 Parallel operations downgraded TO serial 94 29-nov-2016 22:00:09 29-nov-2016 23:00:00 Parallel operations downgraded TO serial 7150 29-nov-2016 21:00:07 29-nov-2016 22:00:09 Parallel operations downgraded TO serial 167 29-nov-2016 20:00:33 29-nov-2016 21:00:07 Parallel operations downgraded TO serial 124 29-nov-2016 19:00:41 29-nov-2016 20:00:33 Parallel operations downgraded TO serial 157 29-nov-2016 18:00:22 29-nov-2016 19:00:41 Parallel operations downgraded TO serial 820 29-nov-2016 17:00:59 29-nov-2016 18:00:22 Parallel operations downgraded TO serial 10 29-nov-2016 16:00:29 29-nov-2016 17:00:59 Parallel operations downgraded TO serial 46 29-nov-2016 15:00:59 29-nov-2016 16:00:29 Parallel operations downgraded TO serial 761 29-nov-2016 14:00:23 29-nov-2016 15:00:59 Parallel operations downgraded TO serial 10342 29-nov-2016 11:00:08 29-nov-2016 12:00:14 Parallel operations downgraded TO serial 8 29-nov-2016 09:00:31 29-nov-2016 10:00:45 Parallel operations downgraded TO serial 163 29-nov-2016 08:00:33 29-nov-2016 09:00:31 Parallel operations downgraded TO serial 47 29-nov-2016 07:00:07 29-nov-2016 08:00:33 Parallel operations downgraded TO serial 10920 29-nov-2016 06:00:17 29-nov-2016 07:00:07 Parallel operations downgraded TO serial 1409 . |
To be honest I was not expecting so high figures as for few 1 hour interval I got more than 10 thousands queries downgraded to serial (!!). The problem is, I think, coming from the maximum number of parallel processes that we have set to contain an applicative issue:
SQL> show parameter parallel_max_servers NAME TYPE VALUE ------------------------------------ ----------- ------------------------------ parallel_max_servers INTEGER 60 |
Unstable execution time
Goal of this chapter is to identify queries that have a highly divergent execution time. The table to use here is DBA_HIST_SQLSTAT that contains tons of very useful information. In this view never ever use the xx_TOTAL columns as if you statement has been aged out from library cache the cumulative value will restart from 0. Discussing with teammates I have decided to use the statistical function called standard deviation that is by default available in Oracle as analytics function called STDDEV. In plain English standard deviation is the average of the difference to average value (!!). Here below I have chosen to keep sql_id that have a maximum elapsed time of 5 minutes and where standard deviation is two times greater that minimum execution time to keep only extreme values:
SQL> SET lines 150 pages 1000 SQL> WITH sql_id_stdded AS (SELECT sql_id, SUM(total_exec) AS total_exec, ROUND(MIN(avg_elapsed_time),2) AS min_elapsed_time, ROUND(MAX(avg_elapsed_time),2) AS max_elapsed_time, ROUND(stddev_elapsed_time,2) AS stddev_elapsed_time FROM (SELECT sql_id, total_exec, avg_elapsed_time, STDDEV(avg_elapsed_time) OVER(PARTITION BY sql_id) AS stddev_elapsed_time FROM (SELECT hsq.sql_id, hsq.plan_hash_value, SUM(NVL(hsq.executions_delta,0)) AS total_exec, SUM(hsq.elapsed_time_delta)/DECODE(SUM(NVL(hsq.executions_delta,0)),0,1,SUM(hsq.executions_delta))/1000000 AS avg_elapsed_time FROM dba_hist_sqlstat hsq, dba_hist_snapshot hsn WHERE hsq.snap_id = hsn.snap_id AND hsq.instance_number = hsn.instance_number AND hsq.executions_delta > 0 GROUP BY hsq.sql_id, hsq.plan_hash_value)) GROUP BY sql_id, stddev_elapsed_time) SELECT sql_id, total_exec, TO_CHAR(CAST(NUMTODSINTERVAL(min_elapsed_time,'second') AS INTERVAL DAY(2) TO SECOND(0))) AS min_elapsed_time, TO_CHAR(CAST(NUMTODSINTERVAL(max_elapsed_time,'second') AS INTERVAL DAY(2) TO SECOND(0))) AS max_elapsed_time, TO_CHAR(CAST(NUMTODSINTERVAL(stddev_elapsed_time,'second') AS INTERVAL DAY(2) TO SECOND(0))) AS stddev_elapsed_time FROM sql_id_stdded WHERE stddev_elapsed_time>2*min_elapsed_time AND max_elapsed_time>5*60 AND total_exec>1 ORDER BY stddev_elapsed_time DESC; SQL_ID TOTAL_EXEC MIN_ELAPSED_T MAX_ELAPSED_T STDDEV_ELAPSE ------------- ---------- ------------- ------------- ------------- 6hds16zkc8cgm 9 +00 00:09:04 +00 05:29:46 +00 01:49:56 76g9pn3z3a35u 8 +00 00:07:23 +00 02:47:35 +00 01:13:09 6w05thcf4w6pm 2 +00 00:02:30 +00 01:38:45 +00 01:08:04 bmtkpjynyhs88 8 +00 00:02:19 +00 02:38:59 +00 01:08:00 7k9cjk1q686f2 10 +00 00:09:38 +00 02:20:49 +00 00:53:56 56xyy7uq071g6 4 +00 00:08:56 +00 01:30:50 +00 00:44:57 cvbq6vqk8dbf3 13 +00 00:01:36 +00 02:25:31 +00 00:44:04 g5khnky3q36m1 18 +00 00:07:37 +00 01:38:04 +00 00:37:19 cru4zku27tv0p 2 +00 00:00:55 +00 00:47:09 +00 00:32:42 2m2ww08p9btvc 2 +00 00:09:50 +00 00:48:35 +00 00:27:24 08kdqk1abqm0v 2 +00 00:07:34 +00 00:45:43 +00 00:26:59 12txp882z4ucy 16 +00 00:04:17 +00 00:57:28 +00 00:22:17 1gta6uu65u8nw 14 +00 00:06:16 +00 00:48:53 +00 00:20:15 gcdtt7t6rf0hg 16 +00 00:02:59 +00 00:51:18 +00 00:18:29 3kffqq3kwta74 3 +00 00:00:43 +00 00:32:37 +00 00:18:13 1nqaj68tn9xp2 2 +00 00:05:46 +00 00:28:15 +00 00:15:54 b8pyc5puhh9c7 8 +00 00:00:49 +00 00:29:44 +00 00:15:40 2svyb8a5n6qb5 10 +00 00:00:56 +00 00:45:44 +00 00:15:31 8zsu7t63hj1zp 14 +00 00:03:46 +00 00:33:57 +00 00:14:13 1tdc0da6km50h 67 +00 00:01:09 +00 00:30:28 +00 00:14:04 3uvcgnm27xf1c 3 +00 00:06:21 +00 00:33:03 +00 00:13:22 ch3xpjhf3y2bf 11 +00 00:03:51 +00 00:22:21 +00 00:13:05 fdcpq4j8kxd49 13 +00 00:04:31 +00 00:22:50 +00 00:12:57 csctx8ttu58d9 25 +00 00:00:30 +00 00:26:47 +00 00:12:15 dv1cvuw300ny4 11 +00 00:03:14 +00 00:28:38 +00 00:10:40 gsx2423tf2a7f 7 +00 00:04:35 +00 00:29:30 +00 00:10:33 62nt4sxdsy586 19 +00 00:02:29 +00 00:27:16 +00 00:10:29 1jb164khmsyzj 60 +00 00:00:40 +00 00:19:42 +00 00:09:15 6mgwwp95jaxzz 13 +00 00:03:56 +00 00:15:46 +00 00:08:22 8v38gy0u6a2mk 5 +00 00:01:02 +00 00:15:50 +00 00:08:20 9mt8p7z1wjjkn 9 +00 00:02:12 +00 00:17:34 +00 00:08:09 byd0g9xfpwcuj 2 +00 00:00:10 +00 00:11:15 +00 00:07:51 7pm2wxdvu3mc7 11 +00 00:02:55 +00 00:13:27 +00 00:07:26 4u50sp3h1szcp 5 +00 00:02:52 +00 00:11:38 +00 00:06:12 7430xmabdv8av 3 +00 00:02:25 +00 00:12:17 +00 00:05:01 cd3xmx3sk7vrv 21 +00 00:00:22 +00 00:05:06 +00 00:03:21 36 ROWS selected. |
If we take first sql_id query says minimum execution time is 9 minutes and 4 seconds and maximum one is 5 hours 29 minutes and 46 seconds. What an amazing difference !
To focus on this sql_id you might use something like. It is strongly suggested to execute this query in a graphical query tool because it is difficult to see something in pure command line. All timing are in seconds while size are in MegaBytes:
SQL> SELECT hsq.sql_id, hsq.plan_hash_value, NVL(SUM(hsq.executions_delta),0) AS total_exec, ROUND(SUM(hsq.elapsed_time_delta)/1000000,2) AS elapsed_time_total, ROUND(SUM(hsq.px_servers_execs_delta)/DECODE(SUM(hsq.executions_delta),0,NULL,SUM(hsq.executions_delta)),2) AS avg_px_servers_execs, ROUND(SUM(hsq.elapsed_time_delta)/DECODE(SUM(hsq.executions_delta),0,NULL,SUM(hsq.executions_delta))/1000000,2) AS avg_elapsed_time, ROUND(SUM(hsq.cpu_time_delta)/DECODE(SUM(hsq.executions_delta),0,NULL,SUM(hsq.executions_delta))/1000000,2) AS avg_cpu_time, ROUND(SUM(hsq.iowait_delta)/DECODE(SUM(hsq.executions_delta),0,NULL,SUM(hsq.executions_delta))/1000000,2) AS avg_iowait, ROUND(SUM(hsq.clwait_delta)/DECODE(SUM(hsq.executions_delta),0,NULL,SUM(hsq.executions_delta))/1000000,2) AS avg_cluster_wait, ROUND(SUM(hsq.apwait_delta)/DECODE(SUM(hsq.executions_delta),0,NULL,SUM(hsq.executions_delta))/1000000,2) AS avg_application_wait, ROUND(SUM(hsq.ccwait_delta)/DECODE(SUM(hsq.executions_delta),0,NULL,SUM(hsq.executions_delta))/1000000,2) AS avg_concurrency_wait, ROUND(SUM(hsq.rows_processed_delta)/DECODE(SUM(hsq.executions_delta),0,NULL,SUM(hsq.executions_delta)),2) AS avg_rows_processed, ROUND(SUM(hsq.buffer_gets_delta)/DECODE(SUM(hsq.executions_delta),0,NULL,SUM(hsq.executions_delta)),2) AS avg_buffer_gets, ROUND(SUM(hsq.disk_reads_delta)/DECODE(SUM(hsq.executions_delta),0,NULL,SUM(hsq.executions_delta)),2) AS avg_disk_reads, ROUND(SUM(hsq.direct_writes_delta)/DECODE(SUM(hsq.executions_delta),0,NULL,SUM(hsq.executions_delta)),2) AS avg_direct_writes, ROUND(SUM(hsq.io_interconnect_bytes_delta)/DECODE(SUM(hsq.executions_delta),0,NULL,SUM(hsq.executions_delta))/(1024*1024),0) AS avg_io_interconnect_mb, ROUND(SUM(hsq.physical_read_requests_delta)/DECODE(SUM(hsq.executions_delta),0,NULL,SUM(hsq.executions_delta)),0) AS avg_phys_read_requests, ROUND(SUM(hsq.physical_read_bytes_delta)/DECODE(SUM(hsq.executions_delta),0,NULL,SUM(hsq.executions_delta))/(1024*1024),0) AS avg_phys_read_mb, ROUND(SUM(hsq.physical_write_requests_delta)/DECODE(SUM(hsq.executions_delta),0,NULL,SUM(hsq.executions_delta)),0) AS avg_phys_write_requests, ROUND(SUM(hsq.physical_write_bytes_delta)/DECODE(SUM(hsq.executions_delta),0,NULL,SUM(hsq.executions_delta))/(1024*1024),0) AS avg_phys_write_mb FROM dba_hist_sqlstat hsq WHERE hsq.sql_id='6hds16zkc8cgm' GROUP BY hsq.sql_id, hsq.plan_hash_value; SQL_ID PLAN_HASH_VALUE TOTAL_EXEC ELAPSED_TIME_TOTAL AVG_PX_SERVERS_EXECS AVG_ELAPSED_TIME AVG_CPU_TIME AVG_IOWAIT AVG_CLUSTER_WAIT AVG_APPLICATION_WAIT AVG_CONCURRENCY_WAIT AVG_ROWS_PROCESSED AVG_BUFFER_GETS AVG_DISK_READS AVG_DIRECT_WRITES AVG_IO_INTERCONNECT_MB AVG_PHYS_READ_REQUESTS AVG_PHYS_READ_MB AVG_PHYS_WRITE_REQUESTS AVG_PHYS_WRITE_MB ------------- --------------- ---------- ------------------ -------------------- ---------------- ------------ ---------- ---------------- -------------------- -------------------- ------------------ --------------- -------------- ----------------- ---------------------- ---------------------- ---------------- ----------------------- ----------------- 6hds16zkc8cgm 705417430 2 15342.95 16 7671.48 42.59 7521.09 0 3.14 77.09 959 7948659 739317.5 0 3 187 3 0 0 6hds16zkc8cgm 2195747324 2 1087.57 32 543.78 43.8 354.06 0 1.6 140.49 961 6115419.5 739927.5 0 6 299 6 0 0 6hds16zkc8cgm 4190635369 1 29581.68 32 29581.68 44.39 29366.99 0 0 131.88 1226 6573306 709640 0 7 350 7 0 0 6hds16zkc8cgm 1445916266 1 8639.51 12 8639.51 37.77 8538.27 0 7.14 50.05 919 4620163 698482 0 7 342 7 0 0 6hds16zkc8cgm 3246633284 1 15650.16 12 15650.16 47.34 15533.76 0 .42 51.99 1364 7318402 731331 0 1 73 1 0 0 6hds16zkc8cgm 463109863 1 7905.76 16 7905.76 41.31 7761.58 0 0 72.88 890 4709496 756848 0 7 330 7 0 0 6hds16zkc8cgm 2566346142 1 9315.98 27 9315.98 53.88 9131.03 0 5.2 93.75 1394 11788790 754218 0 5 211 5 0 0 6hds16zkc8cgm 2387297713 1 5672.93 12 5672.93 43.45 5565.33 0 27.04 35.22 1074 8563338 697194 0 0 31 0 0 0 8 ROWS selected. |
PLAN_HASH_VALUE column is the column to use to understand if too SQL plan are identical or not rather than comparing plans line by line. Here above we see that SQL plan of the same SQL is almost never the same, that could explain the huge difference in response time. We also see huge differences in I/O wait time from 354 seconds to 29366 seconds…
To display all the different plan and start to dig into them you can use (I’m not displaying mine as it would be too long):
SELECT * FROM TABLE(dbms_xplan.display_awr(sql_id=>'6hds16zkc8cgm',format=>'all allstats')); |
You should correlate the above figures with what you can find in DBA_HIST_ACTIVE_SESS_HISTORY. Do not use TIME_WAITED column in this view but count 10 seconds per line. 10 seconds because it is the frequency of snapshot taken from V$ACTIVE_SESSION_HISTORY. And V$ACTIVE_SESSION_HISTORY has a frequency of 1 second (that’s why you would simply use count if selecting from V$ACTIVE_SESSION_HISTORY):
SQL> SET lines 150 pages 1000 SQL> col wait_class FOR a15 SQL> col event FOR a35 SQL> SELECT sql_id, sql_plan_hash_value, actual_dop, TO_CHAR(sql_exec_start,'dd-mon-yyyy hh24:mi:ss') AS sql_exec_start, wait_class, event, COUNT(*)*10 AS "time_waited (s)" FROM (SELECT sql_id,sql_plan_hash_value,TRUNC(px_flags / 2097152) AS actual_dop, sql_exec_start, DECODE(NVL(wait_class,'ON CPU'),'ON CPU',DECODE(session_type,'BACKGROUND','BCPU','CPU'),wait_class) AS wait_class, NVL(event,'ON CPU') AS event FROM dba_hist_active_sess_history WHERE sql_id='6hds16zkc8cgm') a GROUP BY sql_id, sql_plan_hash_value, actual_dop, sql_exec_start, wait_class,event ORDER BY sql_exec_start, sql_plan_hash_value, wait_class,event; SQL_ID SQL_PLAN_HASH_VALUE ACTUAL_DOP SQL_EXEC_START WAIT_CLASS EVENT time_waited (s) ------------- ------------------- ---------- -------------------- --------------- ----------------------------------- --------------- 6hds16zkc8cgm 4190635369 16 01-dec-2016 15:38:50 CPU ON CPU 10 6hds16zkc8cgm 4190635369 0 01-dec-2016 15:38:50 Other reliable message 20 6hds16zkc8cgm 4190635369 16 01-dec-2016 15:38:50 USER I/O db FILE parallel read 1830 6hds16zkc8cgm 4190635369 16 01-dec-2016 15:38:50 USER I/O db FILE sequential read 160 6hds16zkc8cgm 4190635369 16 01-dec-2016 15:38:50 USER I/O direct PATH read 27030 6hds16zkc8cgm 4190635369 16 01-dec-2016 15:38:50 USER I/O read BY other SESSION 180 6hds16zkc8cgm 2566346142 0 02-dec-2016 16:40:27 Application enq: KO - fast object checkpoint 10 6hds16zkc8cgm 2566346142 14 02-dec-2016 16:40:27 CPU ON CPU 300 6hds16zkc8cgm 2566346142 0 02-dec-2016 16:40:27 Configuration LOG buffer SPACE 10 6hds16zkc8cgm 2566346142 14 02-dec-2016 16:40:27 USER I/O db FILE sequential read 10 6hds16zkc8cgm 2566346142 14 02-dec-2016 16:40:27 USER I/O direct PATH read 8240 6hds16zkc8cgm 2566346142 14 02-dec-2016 16:40:27 USER I/O read BY other SESSION 650 6hds16zkc8cgm 2195747324 16 16-nov-2016 16:17:50 CPU ON CPU 20 6hds16zkc8cgm 2195747324 16 16-nov-2016 16:17:50 USER I/O db FILE sequential read 300 6hds16zkc8cgm 1759484988 17-nov-2016 18:11:25 CPU ON CPU 30 6hds16zkc8cgm 1759484988 0 17-nov-2016 18:11:25 Other reliable message 10 6hds16zkc8cgm 1759484988 17-nov-2016 18:11:25 USER I/O db FILE parallel read 140 6hds16zkc8cgm 1759484988 17-nov-2016 18:11:25 USER I/O db FILE scattered read 10 6hds16zkc8cgm 1759484988 17-nov-2016 18:11:25 USER I/O db FILE sequential read 70 6hds16zkc8cgm 2195747324 18-nov-2016 18:06:45 CPU ON CPU 50 6hds16zkc8cgm 2195747324 18-nov-2016 18:06:45 USER I/O db FILE parallel read 30 6hds16zkc8cgm 2195747324 18-nov-2016 18:06:45 USER I/O db FILE sequential read 50 6hds16zkc8cgm 3246633284 0 19-nov-2016 16:19:49 Application enq: KO - fast object checkpoint 10 6hds16zkc8cgm 3246633284 19-nov-2016 16:19:49 CPU ON CPU 20 6hds16zkc8cgm 3246633284 19-nov-2016 16:19:49 Scheduler resmgr:cpu quantum 10 6hds16zkc8cgm 3246633284 19-nov-2016 16:19:49 USER I/O db FILE parallel read 770 6hds16zkc8cgm 3246633284 19-nov-2016 16:19:49 USER I/O db FILE sequential read 30 6hds16zkc8cgm 2195747324 20-nov-2016 15:41:33 CPU ON CPU 20 6hds16zkc8cgm 2195747324 0 20-nov-2016 15:41:33 Other reliable message 10 6hds16zkc8cgm 2195747324 20-nov-2016 15:41:33 USER I/O db FILE parallel read 160 6hds16zkc8cgm 2195747324 20-nov-2016 15:41:33 USER I/O db FILE sequential read 20 6hds16zkc8cgm 2195747324 20-nov-2016 15:41:33 USER I/O read BY other SESSION 10 6hds16zkc8cgm 2195747324 21-nov-2016 15:49:06 CPU ON CPU 20 6hds16zkc8cgm 2195747324 0 21-nov-2016 15:49:06 Other reliable message 10 6hds16zkc8cgm 2195747324 21-nov-2016 15:49:06 USER I/O db FILE parallel read 140 6hds16zkc8cgm 2195747324 21-nov-2016 15:49:06 USER I/O db FILE sequential read 40 6hds16zkc8cgm 463109863 8 22-nov-2016 16:54:09 CPU ON CPU 20 6hds16zkc8cgm 463109863 0 22-nov-2016 16:54:09 Other reliable message 10 6hds16zkc8cgm 463109863 8 22-nov-2016 16:54:09 USER I/O db FILE parallel read 550 6hds16zkc8cgm 463109863 8 22-nov-2016 16:54:09 USER I/O db FILE sequential read 30 6hds16zkc8cgm 463109863 8 22-nov-2016 16:54:09 USER I/O direct PATH read 7120 6hds16zkc8cgm 2387297713 0 23-nov-2016 17:06:32 Application enq: KO - fast object checkpoint 20 6hds16zkc8cgm 2387297713 6 23-nov-2016 17:06:32 CPU ON CPU 30 6hds16zkc8cgm 2387297713 0 23-nov-2016 17:06:32 Configuration LOG buffer SPACE 10 6hds16zkc8cgm 2387297713 6 23-nov-2016 17:06:32 USER I/O db FILE sequential read 40 6hds16zkc8cgm 2387297713 6 23-nov-2016 17:06:32 USER I/O direct PATH read 5480 6hds16zkc8cgm 2387297713 6 23-nov-2016 17:06:32 USER I/O read BY other SESSION 60 6hds16zkc8cgm 705417430 6 24-nov-2016 16:48:13 CPU ON CPU 60 6hds16zkc8cgm 705417430 6 24-nov-2016 16:48:13 Configuration LOG buffer SPACE 20 6hds16zkc8cgm 705417430 6 24-nov-2016 16:48:13 USER I/O db FILE sequential read 400 6hds16zkc8cgm 705417430 6 24-nov-2016 16:48:13 USER I/O direct PATH read 5780 6hds16zkc8cgm 705417430 6 24-nov-2016 16:48:13 USER I/O read BY other SESSION 170 6hds16zkc8cgm 3246633284 6 25-nov-2016 15:39:23 CPU ON CPU 70 6hds16zkc8cgm 3246633284 6 25-nov-2016 15:39:23 USER I/O db FILE parallel read 1980 6hds16zkc8cgm 3246633284 6 25-nov-2016 15:39:23 USER I/O db FILE sequential read 80 6hds16zkc8cgm 3246633284 6 25-nov-2016 15:39:23 USER I/O direct PATH read 13430 6hds16zkc8cgm 3246633284 6 25-nov-2016 15:39:23 USER I/O read BY other SESSION 10 6hds16zkc8cgm 2195747324 16 26-nov-2016 15:32:14 CPU ON CPU 50 6hds16zkc8cgm 2195747324 16 26-nov-2016 15:32:14 USER I/O db FILE sequential read 140 6hds16zkc8cgm 2195747324 16 26-nov-2016 15:32:14 USER I/O direct PATH read 360 6hds16zkc8cgm 2195747324 16 26-nov-2016 15:32:14 USER I/O read BY other SESSION 10 6hds16zkc8cgm 2195747324 16 27-nov-2016 16:27:27 CPU ON CPU 40 6hds16zkc8cgm 2195747324 16 27-nov-2016 16:27:27 USER I/O direct PATH read 280 6hds16zkc8cgm 705417430 0 28-nov-2016 16:42:39 Application enq: KO - fast object checkpoint 10 6hds16zkc8cgm 705417430 10 28-nov-2016 16:42:39 CPU ON CPU 10 6hds16zkc8cgm 705417430 10 28-nov-2016 16:42:39 Concurrency buffer busy waits 90 6hds16zkc8cgm 705417430 10 28-nov-2016 16:42:39 Configuration LOG buffer SPACE 10 6hds16zkc8cgm 705417430 0 28-nov-2016 16:42:39 Other reliable message 10 6hds16zkc8cgm 705417430 10 28-nov-2016 16:42:39 USER I/O direct PATH read 8520 6hds16zkc8cgm 1445916266 0 29-nov-2016 16:33:40 Application enq: KO - fast object checkpoint 10 6hds16zkc8cgm 1445916266 6 29-nov-2016 16:33:40 CPU ON CPU 30 6hds16zkc8cgm 1445916266 6 29-nov-2016 16:33:40 USER I/O db FILE parallel read 880 6hds16zkc8cgm 1445916266 6 29-nov-2016 16:33:40 USER I/O db FILE sequential read 120 6hds16zkc8cgm 1445916266 6 29-nov-2016 16:33:40 USER I/O direct PATH read 7520 6hds16zkc8cgm 1445916266 6 29-nov-2016 16:33:40 USER I/O read BY other SESSION 30 6hds16zkc8cgm 463109863 0 30-nov-2016 16:33:40 CPU ON CPU 10 6hds16zkc8cgm 463109863 15 30-nov-2016 16:33:40 CPU ON CPU 10 6hds16zkc8cgm 463109863 15 30-nov-2016 16:33:40 USER I/O db FILE sequential read 150 6hds16zkc8cgm 463109863 15 30-nov-2016 16:33:40 USER I/O direct PATH read 190 6hds16zkc8cgm 463109863 0 CPU ON CPU 20 6hds16zkc8cgm 463109863 CPU ON CPU 10 6hds16zkc8cgm 463109863 0 Concurrency CURSOR: pin S wait ON X 430 6hds16zkc8cgm 463109863 0 Concurrency LIBRARY cache LOCK 10 6hds16zkc8cgm 705417430 0 CPU ON CPU 10 6hds16zkc8cgm 705417430 CPU ON CPU 10 6hds16zkc8cgm 705417430 0 Concurrency CURSOR: pin S wait ON X 90 6hds16zkc8cgm 705417430 0 Concurrency LIBRARY cache LOCK 20 6hds16zkc8cgm 1445916266 CPU ON CPU 10 6hds16zkc8cgm 2195747324 CPU ON CPU 40 6hds16zkc8cgm 2195747324 0 CPU ON CPU 10 6hds16zkc8cgm 2195747324 0 Concurrency CURSOR: pin S wait ON X 310 6hds16zkc8cgm 2387297713 0 CPU ON CPU 10 6hds16zkc8cgm 2387297713 0 Concurrency CURSOR: pin S wait ON X 110 6hds16zkc8cgm 3246633284 CPU ON CPU 10 6hds16zkc8cgm 3246633284 0 CPU ON CPU 10 6hds16zkc8cgm 3246633284 0 Concurrency CURSOR: pin S wait ON X 110 6hds16zkc8cgm 3246633284 USER I/O db FILE sequential read 10 6hds16zkc8cgm 4190635369 0 CPU ON CPU 10 6hds16zkc8cgm 4190635369 0 Concurrency CURSOR: pin S wait ON X 310 99 ROWS selected. |
We see that top number one wait even while executing our query is direct path read. This wait event is new in 11g where Oracle has decided to bypass buffer cache and read directly in PGA for large table that does not fit in SGA. Overall it is not really an issue, THE SQL behind must be tune to favor more optimal choices. See Direct path chapter for more information.
Direct path
On one of our database we had below Top Foreground wait event:

Even if you will immediately focus on SQL tuning you might want to know which SQL are mainly responsible of this:
SQL> SET lines 150 pages 1000 SQL> col wait_class FOR a10 SQL> col event FOR a25 SQL> SELECT sql_id, sql_plan_hash_value, TO_CHAR(sql_exec_start,'dd-mon-yyyy hh24:mi:ss') AS sql_exec_start, wait_class, event, COUNT(*)*10 AS "time_waited (s)" FROM (SELECT sql_id,sql_plan_hash_value,sql_exec_start, DECODE(NVL(wait_class,'ON CPU'),'ON CPU',DECODE(session_type,'BACKGROUND','BCPU','CPU'),wait_class) AS wait_class, NVL(event,'ON CPU') AS event FROM dba_hist_active_sess_history WHERE event LIKE '%direct%') a GROUP BY sql_id, sql_plan_hash_value, sql_exec_start, wait_class,event ORDER BY 6 DESC; SQL_ID SQL_PLAN_HASH_VALUE SQL_EXEC_START WAIT_CLASS EVENT time_waited (s) ------------- ------------------- -------------------- ---------- ------------------------- --------------- amzmxuns5dctz 1006290636 21-nov-2016 15:30:51 USER I/O direct PATH read temp 117670 amzmxuns5dctz 2716462349 30-nov-2016 15:28:23 USER I/O direct PATH read temp 101540 amzmxuns5dctz 2716462349 03-dec-2016 15:40:04 USER I/O direct PATH read temp 96800 0 USER I/O direct PATH read 90720 amzmxuns5dctz 1006290636 25-nov-2016 06:39:34 USER I/O direct PATH WRITE temp 50740 f92r4f37kn015 2776764876 30-nov-2016 03:22:25 USER I/O direct PATH WRITE temp 48010 114w500wy5039 2301194886 04-dec-2016 16:34:14 USER I/O direct PATH WRITE temp 45480 cvbq6vqk8dbf3 720130659 25-nov-2016 15:42:05 USER I/O direct PATH read 36520 amzmxuns5dctz 2716462349 26-nov-2016 15:40:00 USER I/O direct PATH read temp 33610 f92r4f37kn015 2776764876 24-nov-2016 00:57:35 USER I/O direct PATH WRITE temp 33300 b2cwuxca44yw8 1919045833 01-dec-2016 16:30:03 USER I/O direct PATH read 31890 amzmxuns5dctz 2716462349 30-nov-2016 06:35:58 USER I/O direct PATH read temp 31830 amzmxuns5dctz 1006290636 24-nov-2016 15:10:44 USER I/O direct PATH read temp 28210 amzmxuns5dctz 2716462349 30-nov-2016 06:35:58 USER I/O direct PATH WRITE temp 27350 6hds16zkc8cgm 4190635369 01-dec-2016 15:38:50 USER I/O direct PATH read 27030 amzmxuns5dctz 2716462349 28-nov-2016 15:13:16 USER I/O direct PATH read temp 26850 6hds16zkc8cgm 3246633284 05-dec-2016 16:15:22 USER I/O direct PATH read 23020 aqh9x3yay6khc 2336987607 21-nov-2016 20:54:01 USER I/O direct PATH read temp 21060 amzmxuns5dctz 2716462349 01-dec-2016 15:08:29 USER I/O direct PATH read temp 20510 9mt8p7z1wjjkn 2327812543 04-dec-2016 11:00:32 USER I/O direct PATH read 20450 48091vbtjj4xa 1708748504 28-nov-2016 04:03:28 USER I/O direct PATH read temp 20090 amzmxuns5dctz 2716462349 03-dec-2016 06:36:36 USER I/O direct PATH WRITE temp 17190 f92r4f37kn015 2776764876 27-nov-2016 00:41:30 USER I/O direct PATH read temp 17190 amzmxuns5dctz 2716462349 29-nov-2016 15:43:15 USER I/O direct PATH read temp 16860 1wzd30k3m1ghn 1433478644 07-dec-2016 06:29:49 USER I/O direct PATH read temp 15990 amzmxuns5dctz 2716462349 30-nov-2016 15:28:23 USER I/O direct PATH WRITE temp 15830 amzmxuns5dctz 2716462349 07-dec-2016 06:35:28 USER I/O direct PATH WRITE temp 14850 1wzd30k3m1ghn 1433478644 29-nov-2016 08:07:57 USER I/O direct PATH read temp 14850 08kdqk1abqm0v 2813508085 04-dec-2016 15:49:02 USER I/O direct PATH read 14680 aqh9x3yay6khc 2336987607 22-nov-2016 21:07:34 USER I/O direct PATH read temp 14450 5tjqq1cggd0c2 3765923229 23-nov-2016 19:04:17 USER I/O direct PATH read 14280 5tjqq1cggd0c2 1896303415 22-nov-2016 19:23:11 USER I/O direct PATH read 14210 5tjqq1cggd0c2 3837189456 29-nov-2016 19:34:04 USER I/O direct PATH read 14010 grb144xf2asf3 759327608 25-nov-2016 22:17:39 USER I/O direct PATH read 13790 f92r4f37kn015 2776764876 05-dec-2016 00:11:15 USER I/O direct PATH read temp 13460 6hds16zkc8cgm 3246633284 25-nov-2016 15:39:23 USER I/O direct PATH read 13430 amzmxuns5dctz 1006290636 21-nov-2016 07:14:12 USER I/O direct PATH read temp 12780 b4yrbsczwf9xw 3470921796 27-nov-2016 03:58:25 USER I/O direct PATH read 12720 grb144xf2asf3 1075986364 05-dec-2016 22:48:32 USER I/O direct PATH read 12310 g8n42y0duhggt 152545410 24-nov-2016 21:13:25 USER I/O direct PATH read 12060 a2xhxhppc23y1 327407190 06-dec-2016 22:56:59 USER I/O direct PATH read 11930 1wzd30k3m1ghn 1433478644 23-nov-2016 07:13:00 USER I/O direct PATH read temp 11820 0pmqzssfmmdcv 3444765716 04-dec-2016 01:57:54 USER I/O direct PATH read 11480 1zzsqqwax38kk 660240898 27-nov-2016 06:58:14 USER I/O direct PATH read 11200 amzmxuns5dctz 2716462349 07-dec-2016 06:35:28 USER I/O direct PATH read temp 11160 aqh9x3yay6khc 2336987607 29-nov-2016 20:01:40 USER I/O direct PATH read temp 11110 ckapap92tfy3n 2695238043 23-nov-2016 23:47:49 USER I/O direct PATH read 11050 aqh9x3yay6khc 2336987607 03-dec-2016 22:33:33 USER I/O direct PATH read temp 10990 amzmxuns5dctz 2716462349 03-dec-2016 06:36:36 USER I/O direct PATH read temp 10950 1wzd30k3m1ghn 1433478644 26-nov-2016 06:48:59 USER I/O direct PATH read temp 10950 1wzd30k3m1ghn 1433478644 06-dec-2016 06:45:53 USER I/O direct PATH read temp 10870 1wzd30k3m1ghn 1433478644 02-dec-2016 06:41:28 USER I/O direct PATH read temp 10690 57svfqqryy7h0 3182238936 28-nov-2016 05:17:30 USER I/O direct PATH read 10540 74447zmmmw0zk 316009422 29-nov-2016 02:41:26 USER I/O direct PATH read 10470 f92r4f37kn015 2776764876 28-nov-2016 02:22:45 USER I/O direct PATH read temp 10310 0cy2upaz2mtp3 420311346 01-dec-2016 17:54:20 USER I/O direct PATH read 10220 daxpwau39csac 2945512965 29-nov-2016 18:07:05 USER I/O direct PATH read 10200 0 USER I/O direct PATH WRITE 10060 . |
NULL sql_id is checkpoint process.
Here above we see than sql_id amzmxuns5dctz is the one to focus on…
Checkpoint
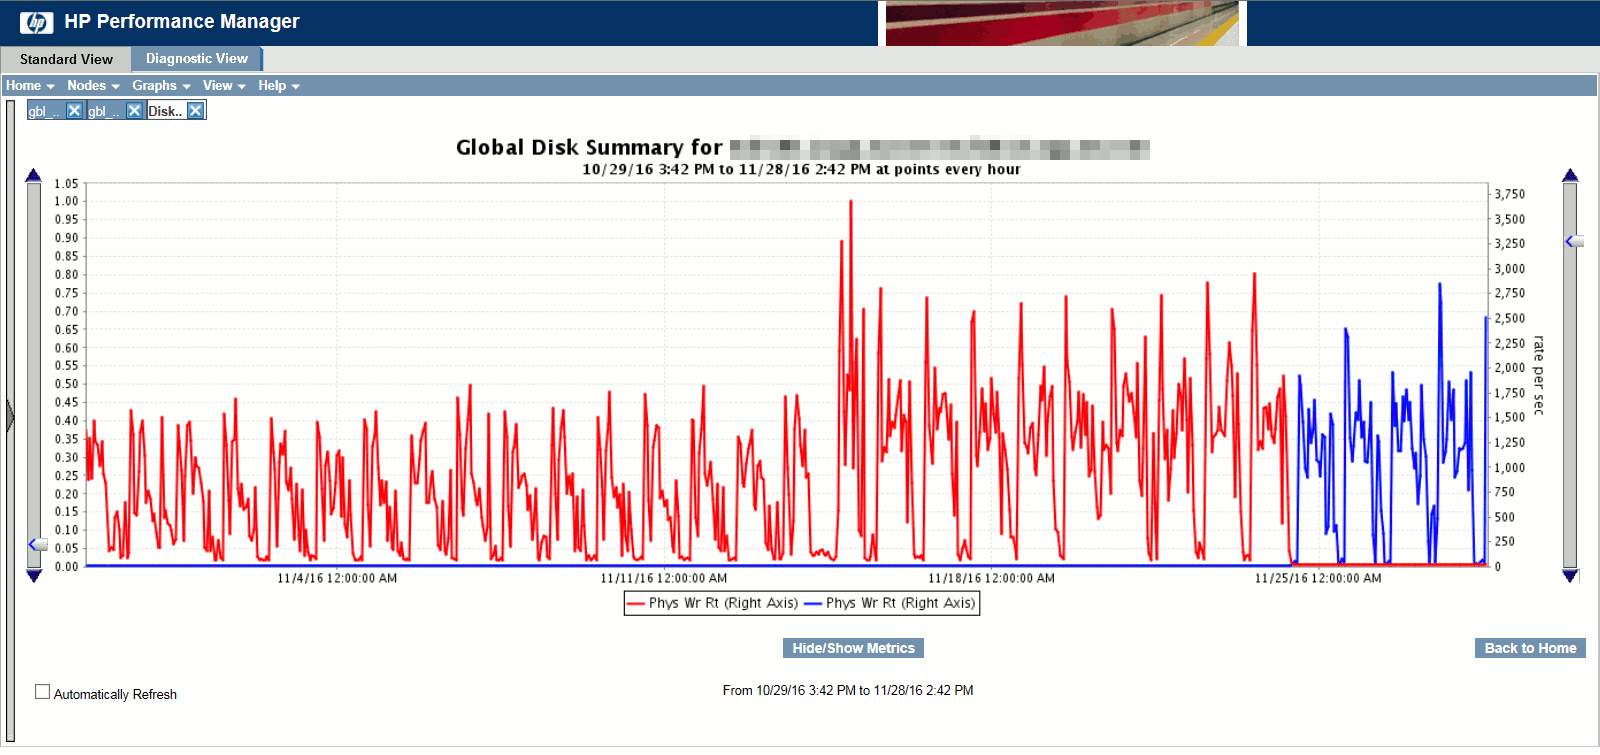
After a reboot of our database we have (luckily) noticed a huge increase in physical writes as shown in HP Performance Manager application:
We have investigated in all directions we could: OS, database, SQL tuning,… We noticed we mistakenly (since long time) set FAST_START_MTTR_TARGET to 300. To be honest I have never really understood the added value of this parameter even if I understand the description. What’s the point to tune a situation (recovery) that (hopefully) happen rarely and impacting all year long your performance. I prefer to let the checkpoint occur at redo log switch and set FAST_START_MTTR_TARGET to 0 (default value).
Anyways that said we reset the parameter and guess what ? Physical write decreased a lot:

Then I wanted to see at Oracle the decrease in number of checkpoint as well as decrease in number of write due to incremental check pointing activity. DBA_HIST_SYSSTAT comes to the rescue. In meanwhile a teammate changed AWR frequency so I had to tune a bit my query to have the sum per hour:
SELECT TO_CHAR(TRUNC(begin_interval_time,'HH'),'dd-mon-yyyy hh24:mi:ss') AS TIME, stat_name, SUM(VALUE) AS VALUE FROM( SELECT hsn.snap_id, hsn.begin_interval_time, hsn.end_interval_time, hsy.stat_name, hsy.VALUE - hsy.prev_value AS VALUE FROM (SELECT snap_id,instance_number,stat_name,VALUE,LAG(VALUE,1,VALUE) OVER (ORDER BY snap_id,stat_name) AS prev_value FROM dba_hist_sysstat WHERE stat_name IN 'DBWR checkpoints') hsy, dba_hist_snapshot hsn WHERE hsy.snap_id = hsn.snap_id AND hsy.instance_number = hsn.instance_number ORDER BY hsn.snap_id DESC) GROUP BY TRUNC(begin_interval_time,'HH'),snap_id,stat_name ORDER BY snap_id; |
The two statistics name I will use are (please refer to official documenatiopn or V$STATNAME for a complete list of available ones):
| Name | Description |
|---|---|
| DBWR checkpoint buffers written | Number of buffers that were written for checkpoints |
| DBWR checkpoints | Number of times the DBWR was asked to scan the cache and write all blocks marked for a checkpoint or the end of recovery. This statistic is always larger than “background checkpoints completed” |
I initially exported the result set in Excel format and build graph in Excel directly but finally decided to test the graph capability of SQL Developer. To access it use the Reports tab, or activate it in View and Reports menu. Then Create a new one in User Defined Reports using Chart style and Area as Chart Type, and any other option you like. A good trick is to connect to a database and check the Use Live Data in Property/Data option to directly see how your report looks like.
The queries to be displayed must be built to return the following three values: ‘x axis value’,’serie name’ and ‘y axis value’.
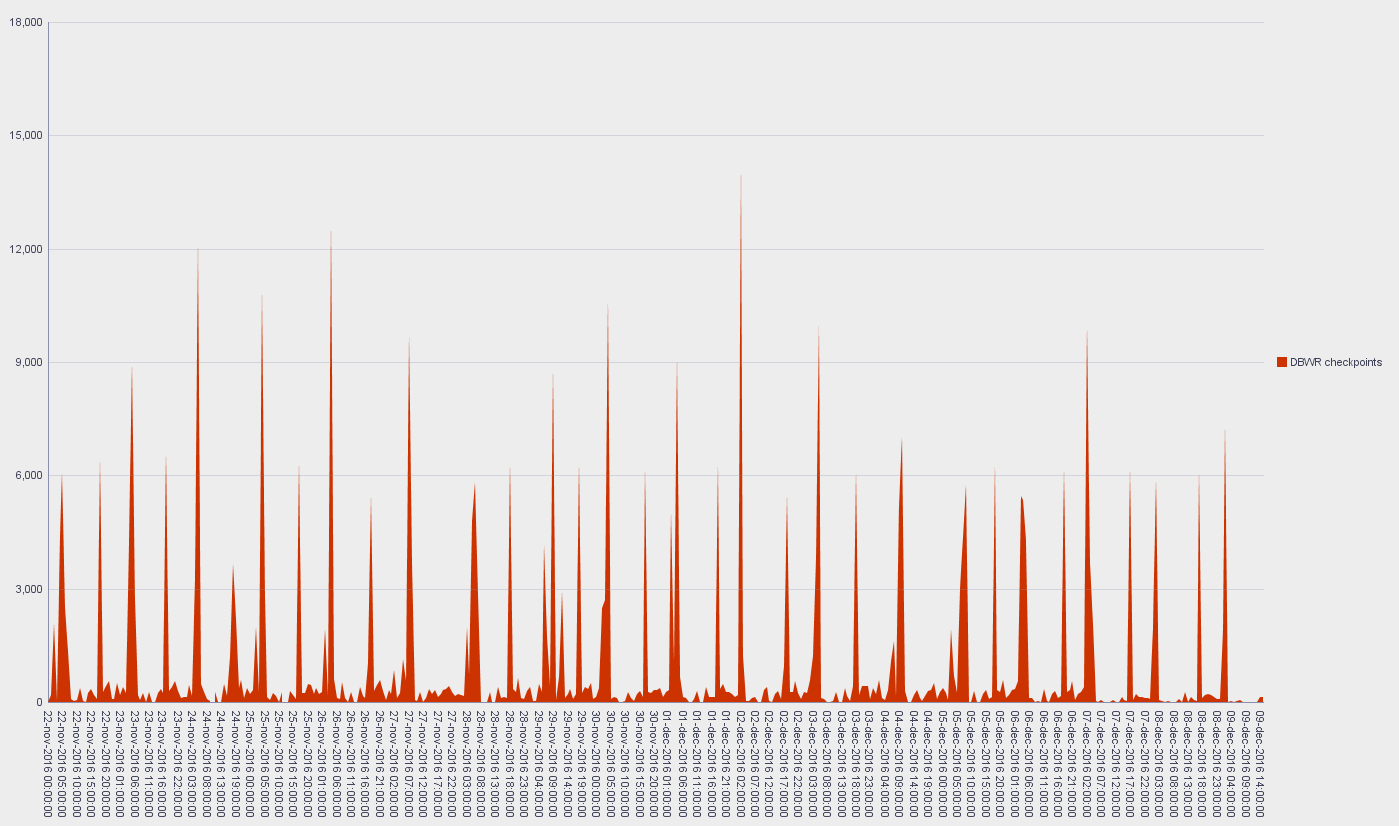
We see number of checkpoint decreasing after December the 7TH AM (we did the change around 10:00 AM CET):
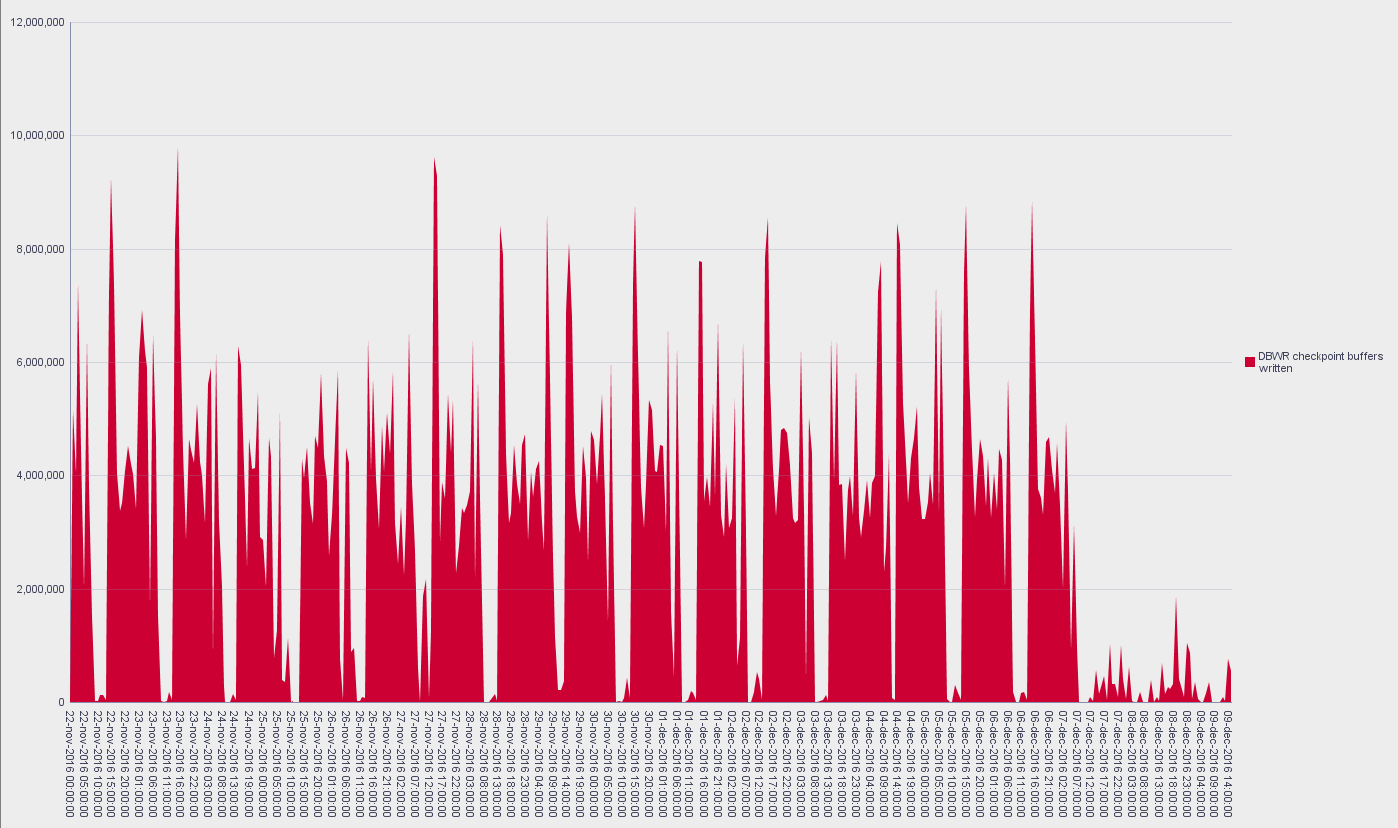
But more impressive the number of buffer written:
But we did not change anything on the database before the applicative started to complain all their queries were slow. The change in FAST_START_MTTR_TARGET solved performance troubles but does not explain the root cause of the issue. Restoring a backup we have been able to extract and load old AWR figures (see chapter on this) to finally be able to perform difference AWR reports. Then obviously I have focused on Top Segments Comparison by Physical Writes paragraph of my AWR difference report (a good day before the issue versus a bad one) and saw this:
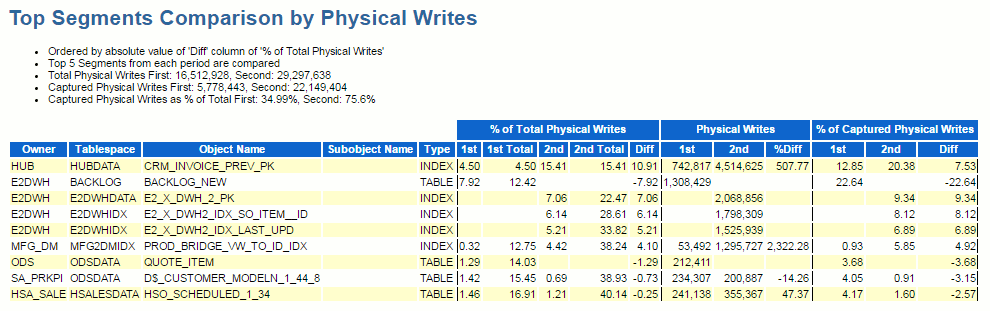
I noticed many new comers in top physical writes while the first one had 500% increase in number of physical writes…
The table to use in this situation is DBA_HIST_SEG_STAT, but you need the object id to fetch it:
SQL> SET lines 150 pages 1000 SQL> col object_name FOR a30 SQL> SELECT object_id,owner,object_name,object_type FROM dba_objects WHERE owner||'.'||object_name IN ('HUB.CRM_INVOICE_PREV_PK','E2DWH.BACKLOG_NEW', 'E2DWH.E2_X_DWH_2_PK','E2DWH.E2_X_DWH2_IDX_SO_ITEM__ID','E2DWH.E2_X_DWH2_IDX_LAST_UPD'); OBJECT_ID OWNER OBJECT_NAME OBJECT_TYPE ---------- ------------------------------ ------------------------------ ------------------- 43994766 E2DWH BACKLOG_NEW TABLE 44003115 HUB CRM_INVOICE_PREV_PK INDEX 44005025 E2DWH E2_X_DWH2_IDX_SO_ITEM__ID INDEX 44005026 E2DWH E2_X_DWH2_IDX_LAST_UPD INDEX 44005027 E2DWH E2_X_DWH_2_PK INDEX |
Or as they claim use DBA_HIST_SEG_STAT_OBJ table (even if it is really difficult to guess which key this table has):
SQL> SET lines 150 pages 1000 SQL> col object_name FOR a50 SQL> SELECT DISTINCT obj#,owner||'.'||object_name||' ('||NVL2(subobject_name,object_type || ': ' || subobject_name,object_type)||')' AS object_name FROM DBA_HIST_SEG_STAT_OBJ WHERE owner||'.'||OBJECT_NAME IN ('HUB.CRM_INVOICE_PREV_PK','E2DWH.BACKLOG_NEW', 'E2DWH.E2_X_DWH_2_PK','E2DWH.E2_X_DWH2_IDX_SO_ITEM__ID','E2DWH.E2_X_DWH2_IDX_LAST_UPD'); OBJ# OBJECT_NAME ---------- -------------------------------------------------- 43994766 E2DWH.BACKLOG_NEW (TABLE) 44005027 E2DWH.E2_X_DWH_2_PK (INDEX) 44005026 E2DWH.E2_X_DWH2_IDX_LAST_UPD (INDEX) 44003115 HUB.CRM_INVOICE_PREV_PK (INDEX) 44005025 E2DWH.E2_X_DWH2_IDX_SO_ITEM__ID (INDEX) |
Then you can access to physical writes of this object with something like:
SQL> SET lines 150 pages 1000 SQL> SELECT TO_CHAR(begin_interval_time,'dd-mon-yyyy hh24:mi:ss') AS begin_interval_time, TO_CHAR(end_interval_time,'dd-mon-yyyy hh24:mi:ss') AS end_interval_time, hss.physical_writes_delta, hss.physical_write_requests_delta FROM dba_hist_seg_stat hss, dba_hist_snapshot hsn WHERE hss.snap_id = hsn.snap_id AND hss.instance_number = hsn.instance_number AND hss.obj# = 44003115 ORDER BY hss.snap_id BEGIN_INTERVAL_TIME END_INTERVAL_TIME PHYSICAL_WRITES_DELTA PHYSICAL_WRITE_REQUESTS_DELTA -------------------- -------------------- --------------------- ----------------------------- 04-nov-2016 14:00:31 04-nov-2016 15:00:48 742817 658007 05-nov-2016 14:00:08 05-nov-2016 15:00:26 749335 652146 05-nov-2016 15:00:26 05-nov-2016 16:00:38 0 0 06-nov-2016 14:00:41 06-nov-2016 15:01:00 815897 718208 07-nov-2016 14:00:20 07-nov-2016 15:00:36 722403 613129 08-nov-2016 14:00:37 08-nov-2016 15:00:56 608903 546690 09-nov-2016 14:00:51 09-nov-2016 15:00:08 633603 549895 10-nov-2016 14:00:39 10-nov-2016 15:00:59 722215 656331 11-nov-2016 14:00:54 11-nov-2016 15:00:14 606513 535992 11-nov-2016 15:00:14 11-nov-2016 16:00:28 0 0 11-nov-2016 16:00:28 11-nov-2016 17:00:46 0 0 11-nov-2016 17:00:46 11-nov-2016 18:02:20 0 0 11-nov-2016 18:02:20 11-nov-2016 19:00:48 0 0 11-nov-2016 19:00:48 11-nov-2016 20:00:15 0 0 18-nov-2016 14:00:40 18-nov-2016 15:00:19 4514625 4298799 19-nov-2016 14:00:22 19-nov-2016 15:00:56 4811683 4610613 20-nov-2016 14:00:28 20-nov-2016 15:00:10 2404822 2267424 21-nov-2016 14:00:08 21-nov-2016 15:00:34 2300106 2145016 22-nov-2016 14:00:06 22-nov-2016 15:00:39 3589330 3428962 22-nov-2016 15:00:39 22-nov-2016 16:00:04 1422715 1373614 23-nov-2016 14:00:39 23-nov-2016 15:00:06 4505033 4318507 23-nov-2016 17:00:40 23-nov-2016 17:10:56 0 0 24-nov-2016 14:00:34 24-nov-2016 15:00:59 2027948 1873524 25-nov-2016 14:00:07 25-nov-2016 14:55:52 4477194 4288564 26-nov-2016 14:00:59 26-nov-2016 15:00:18 2350258 2210634 27-nov-2016 14:00:37 27-nov-2016 15:00:14 4886175 4681261 28-nov-2016 14:00:19 28-nov-2016 15:00:45 2512397 2394625 29-nov-2016 14:00:23 29-nov-2016 15:00:59 3476692 3323396 29-nov-2016 15:00:59 29-nov-2016 16:00:29 1686445 1632668 30-nov-2016 14:01:07 30-nov-2016 15:00:37 4468593 4279528 01-dec-2016 14:00:40 01-dec-2016 15:00:02 2549539 2426793 02-dec-2016 14:00:18 02-dec-2016 15:00:01 4781775 4589442 32 ROWS selected. |
We clearly see the trend with a 7-8 times increase in number of writes.
If you check for a segment that has no figures for a period (appearing or disappearing objects) then the query is a bit more complex to build. In other word building a query to report what appear in a difference AWR report is not so easy. Using standard variance (STDDEV) I have tried to build a query that would show me the segments that have varied the most for physical writes. Again if the segment appear or disappear:
SQL> SET lines 150 pages 1000 SQL> col object_name FOR a50 SQL> SELECT TO_CHAR(hsn.begin_interval_time,'dd-mon-yyyy hh24:mi:ss') AS begin_interval_time, TO_CHAR(hsn.end_interval_time,'dd-mon-yyyy hh24:mi:ss') AS end_interval_time, --obj#, (SELECT DISTINCT owner||'.'||object_name||' ('||NVL2(subobject_name,object_type || ': ' || subobject_name,object_type)||')' FROM dba_hist_seg_stat_obj WHERE obj#=hss.obj# AND dbid=hss.dbid AND dataobj#=hss.dataobj# AND ts#=hss.ts#) AS object_name, hss.physical_writes_delta, hss.stddev_physical_writes_delta FROM (SELECT snap_id, dbid, instance_number, obj#, dataobj#, ts#, physical_writes_delta, ROUND(STDDEV(physical_writes_delta) over (PARTITION BY obj#)) AS stddev_physical_writes_delta, COUNT(*) OVER (PARTITION BY obj#) AS nb FROM dba_hist_seg_stat GROUP BY snap_id,dbid,instance_number,obj#,dataobj#,ts#,physical_writes_delta) hss, dba_hist_snapshot hsn WHERE hss.snap_id = hsn.snap_id AND hss.instance_number = hsn.instance_number AND hss.nb >= 5 ORDER BY stddev_physical_writes_delta DESC,hss.snap_id; BEGIN_INTERVAL_TIME END_INTERVAL_TIME OBJECT_NAME PHYSICAL_WRITES_DELTA STDDEV_PHYSICAL_WRITES_DELTA -------------------- -------------------- -------------------------------------------------- --------------------- ---------------------------- 04-nov-2016 14:00:31 04-nov-2016 15:00:48 HUB.CRM_INVOICE_PREV_PK (INDEX) 742817 1763019 05-nov-2016 14:00:08 05-nov-2016 15:00:26 HUB.CRM_INVOICE_PREV_PK (INDEX) 749335 1763019 05-nov-2016 15:00:26 05-nov-2016 16:00:38 HUB.CRM_INVOICE_PREV_PK (INDEX) 0 1763019 06-nov-2016 14:00:41 06-nov-2016 15:01:00 HUB.CRM_INVOICE_PREV_PK (INDEX) 815897 1763019 07-nov-2016 14:00:20 07-nov-2016 15:00:36 HUB.CRM_INVOICE_PREV_PK (INDEX) 722403 1763019 08-nov-2016 14:00:37 08-nov-2016 15:00:56 HUB.CRM_INVOICE_PREV_PK (INDEX) 608903 1763019 09-nov-2016 14:00:51 09-nov-2016 15:00:08 HUB.CRM_INVOICE_PREV_PK (INDEX) 633603 1763019 10-nov-2016 14:00:39 10-nov-2016 15:00:59 HUB.CRM_INVOICE_PREV_PK (INDEX) 722215 1763019 11-nov-2016 14:00:54 11-nov-2016 15:00:14 HUB.CRM_INVOICE_PREV_PK (INDEX) 606513 1763019 11-nov-2016 15:00:14 11-nov-2016 16:00:28 HUB.CRM_INVOICE_PREV_PK (INDEX) 0 1763019 11-nov-2016 16:00:28 11-nov-2016 17:00:46 HUB.CRM_INVOICE_PREV_PK (INDEX) 0 1763019 11-nov-2016 17:00:46 11-nov-2016 18:02:20 HUB.CRM_INVOICE_PREV_PK (INDEX) 0 1763019 11-nov-2016 18:02:20 11-nov-2016 19:00:48 HUB.CRM_INVOICE_PREV_PK (INDEX) 0 1763019 11-nov-2016 19:00:48 11-nov-2016 20:00:15 HUB.CRM_INVOICE_PREV_PK (INDEX) 0 1763019 18-nov-2016 14:00:40 18-nov-2016 15:00:19 HUB.CRM_INVOICE_PREV_PK (INDEX) 4514625 1763019 19-nov-2016 14:00:22 19-nov-2016 15:00:56 HUB.CRM_INVOICE_PREV_PK (INDEX) 4811683 1763019 20-nov-2016 14:00:28 20-nov-2016 15:00:10 HUB.CRM_INVOICE_PREV_PK (INDEX) 2404822 1763019 21-nov-2016 14:00:08 21-nov-2016 15:00:34 HUB.CRM_INVOICE_PREV_PK (INDEX) 2300106 1763019 22-nov-2016 14:00:06 22-nov-2016 15:00:39 HUB.CRM_INVOICE_PREV_PK (INDEX) 3589330 1763019 22-nov-2016 15:00:39 22-nov-2016 16:00:04 HUB.CRM_INVOICE_PREV_PK (INDEX) 1422715 1763019 23-nov-2016 14:00:39 23-nov-2016 15:00:06 HUB.CRM_INVOICE_PREV_PK (INDEX) 4505033 1763019 23-nov-2016 17:00:40 23-nov-2016 17:10:56 HUB.CRM_INVOICE_PREV_PK (INDEX) 0 1763019 24-nov-2016 14:00:34 24-nov-2016 15:00:59 HUB.CRM_INVOICE_PREV_PK (INDEX) 2027948 1763019 25-nov-2016 14:00:07 25-nov-2016 14:55:52 HUB.CRM_INVOICE_PREV_PK (INDEX) 4477194 1763019 26-nov-2016 14:00:59 26-nov-2016 15:00:18 HUB.CRM_INVOICE_PREV_PK (INDEX) 2350258 1763019 27-nov-2016 14:00:37 27-nov-2016 15:00:14 HUB.CRM_INVOICE_PREV_PK (INDEX) 4886175 1763019 28-nov-2016 14:00:19 28-nov-2016 15:00:45 HUB.CRM_INVOICE_PREV_PK (INDEX) 2512397 1763019 29-nov-2016 14:00:23 29-nov-2016 15:00:59 HUB.CRM_INVOICE_PREV_PK (INDEX) 3476692 1763019 29-nov-2016 15:00:59 29-nov-2016 16:00:29 HUB.CRM_INVOICE_PREV_PK (INDEX) 1686445 1763019 30-nov-2016 14:01:07 30-nov-2016 15:00:37 HUB.CRM_INVOICE_PREV_PK (INDEX) 4468593 1763019 01-dec-2016 14:00:40 01-dec-2016 15:00:02 HUB.CRM_INVOICE_PREV_PK (INDEX) 2549539 1763019 02-dec-2016 14:00:18 02-dec-2016 15:00:01 HUB.CRM_INVOICE_PREV_PK (INDEX) 4781775 1763019 04-nov-2016 00:00:55 04-nov-2016 01:00:44 HUB.CRM_INVOICE_PK (INDEX) 474743 1141594 04-nov-2016 20:00:26 04-nov-2016 21:00:47 HUB.CRM_INVOICE_PK (INDEX) 765938 1141594 05-nov-2016 21:00:38 05-nov-2016 22:00:04 HUB.CRM_INVOICE_PK (INDEX) 919735 1141594 06-nov-2016 19:00:44 06-nov-2016 20:00:11 HUB.CRM_INVOICE_PK (INDEX) 107619 1141594 06-nov-2016 20:00:11 06-nov-2016 21:00:38 HUB.CRM_INVOICE_PK (INDEX) 474607 1141594 07-nov-2016 20:00:30 07-nov-2016 21:00:45 HUB.CRM_INVOICE_PK (INDEX) 725956 1141594 08-nov-2016 20:00:48 08-nov-2016 21:00:02 HUB.CRM_INVOICE_PK (INDEX) 113880 1141594 08-nov-2016 20:00:48 08-nov-2016 21:00:02 HUB.CRM_INVOICE_PK (INDEX) 339013 1141594 . |
In above query I have limited the sample size to at least 5 elements because below this limit I rate standard variance number values makes no sense. We almost get this inside an AWR report except the appearing/disappearing segments…
The Service Request we opened at Oracle support reached to the same exact conclusion…
AWR figures extract and load
If you really come too late to check performance and you then lack the one when they were “good” one of the solution is to restore a database backup and create a temporary database on a test server. You might not always be able to do it but if you can afford do it (at the same time it will validate your backup/restore policy) ! Once this backup has been started export the newest AWR figure from your production database using awrextr.sql script located in in $ORACLE_HOME/rdbms/admin, you just need to create a directory and a bit of free disk space.
Transfer the file to your test server where you have recovered the production backup (so containing old AWR figures) and load in it latest AWR with awrload.sql script located in $ORACLE_HOME/rdbms/admin.
At first try I got below error message:
ERROR AT line 1: ORA-20105: unable TO move AWR data TO SYS ORA-06512: AT "SYS.DBMS_SWRF_INTERNAL", line 2984 ORA-20107: NOT allowed TO move AWR data FOR local dbid ORA-06512: AT line 3 |
So changed the DBID of my restored database with NID (database New ID) tool (of course the restore must has been well done):
[oraxyz@server11 ~]$ nid target=sys DBNAME=sidxyz DBNEWID: Release 11.2.0.4.0 - Production on Fri Dec 9 15:11:09 2016 Copyright (c) 1982, 2011, Oracle and/or its affiliates. All rights reserved. Password: Connected to database EDWHUB (DBID=3256370993) Connected to server version 11.2.0 Control Files in database: /ora_edwhub1/ctrl/edwhub/control01.ctl /ora_edwhub1/ctrl/edwhub/control02.ctl The following datafiles are offline immediate: /ora_edwhub1/data02/edwhub/logdmfact2_01.db (284) /ora_edwhub/data02/edwhub/logdmfact2_01.db (290) NID-00122: Database should have no offline immediate datafiles Change of database name failed during validation - database is intact. DBNEWID - Completed with validation errors. |
Once recover well done and DBID change the import will run successfully and you can then generate AWR difference reports…
References
- A Tour of the AWR Tables
- Active Session History (ASH)
- New Version Of XPLAN_ASH Utility
- DOP Downgrades, or Avoid The Ceiling
- Visualizing Statspack Performance Data in SQL Developer
- Master Note: Overview of Database Checkpoints (Doc ID 1490838.1)
- Automatic Checkpoint Tuning in Oracle 10g (Doc ID 265831.1)
- Unstable Plans (Oracle Plan Stability/Instability)
- SQL Gone Bad – But Plan Not Changed? – Part 1
- Mining The AWR To Identify Performance Trends


