Table of contents
Preamble
When deeply looking at my 11.1 Grid Control for a database that suffer performance issue I played a bit in option (removing CPU Cores, Baselines and displaying Foreground + Background) I got the well know below display:
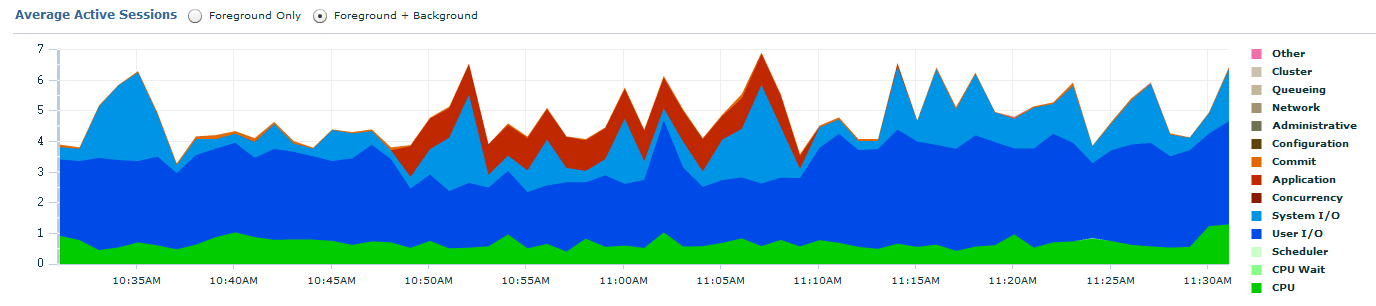
And noticed for first time that y axis unit is average active session and not a wait time in centiseconds or whatever which I would have personally done… but how do they do that ?
This database is an Oracle Database 11g Enterprise Edition Release 11.2.0.1.0 – 64bit Production running on Red Hat Enterprise Linux Server release 5.5 (Tikanga) and I asked myself how would I do to generate it by myself (obviously knowing that all figures are inside Oracle database).
Without CPU Wait
I started to work with V$WAITCLASSMETRIC_HISTORY table that I joined with V$EVENT_NAME to display wait class and remove idle events:
SELECT a.begin_time, b.wait_class, SUM(a.time_waited) FROM V$WAITCLASSMETRIC_HISTORY a, V$EVENT_NAME b WHERE a.wait_class_id = b.wait_class_id AND b.wait_class <>'Idle' GROUP BY a.begin_time, b.wait_class ORDER BY a.begin_time; |
I even, for the first time, used a DataWareHouse way of presenting figures using 11g PIVOT keyword:
ALTER SESSION SET nls_date_format='dd-mon-yyyy hh24:mi:ss'; SELECT * FROM (SELECT a.begin_time, b.wait_class, a.time_waited FROM V$WAITCLASSMETRIC_HISTORY a, V$EVENT_NAME b WHERE a.wait_class_id = b.wait_class_id AND b.wait_class <>'Idle') S PIVOT (SUM(time_waited) FOR wait_class IN ('Administrative','Application', 'Cluster','Commit','Concurrency','Configuration','Network','Other','Queueing', 'Scheduler','System I/O','User I/O')) ORDER BY begin_time; |
Remark:
Unless working in XML the list of categories cannot be a subquery…
The list of categories is given with:
SQL> SET pages 20 SQL> SELECT DISTINCT wait_class FROM V$EVENT_NAME; WAIT_CLASS ---------------------------------------------------------------- Administrative Application CLUSTER COMMIT Concurrency Configuration Idle Network Other Queueing Scheduler SYSTEM I/O USER I/O 13 ROWS selected. |
But then I realized that versus Grid Control charts I’m missing the CPU information and with y axis unit name the source of their chart information is most probably V$ACTIVE_SESSION_HISTORY. This table contains a sample of active database sessions every second. I started with a query like this (last hour interval same as Grid Gontrol):
ALTER SESSION SET nls_date_format='dd-mon-yyyy hh24:mi:ss'; SELECT sample_time, cpu AS cpu, bcpu AS bcpu, scheduler AS scheduler, uio AS uio, sio AS sio, concurrency AS concurrency, application AS application, COMMIT AS COMMIT, configuration AS configuration, administrative AS administrative, network AS network, queueing AS queueing, clust AS clust, --cluster is a keywords other AS other FROM (SELECT sample_time, DECODE(session_state,'ON CPU',DECODE(session_type,'BACKGROUND','BCPU','ON CPU'), wait_class) AS wait_class FROM v$active_session_history WHERE sample_time>sysdate- INTERVAL '1' HOUR) ash PIVOT (COUNT(*) FOR wait_class IN ('ON CPU' AS cpu,'BCPU' AS bcpu,'Scheduler' AS scheduler,'User I/O' AS uio,'System I/O' AS sio, 'Concurrency' AS concurrency,'Application' AS application,'Commit' AS COMMIT,'Configuration' AS configuration, 'Administrative' AS administrative,'Network' AS network,'Queueing' AS queueing,'Cluster' AS clust,'Other' AS other)); |
Remark:
Here we even have more precise information for CPU than Grid Control with foreground and background CPU breakdown.
But when drawing curve with Excel I realized that points frequency is too high and did not produce a good graphic. If you closely look to Grid Control graphics you’ll realize that they have a point every minutes (which also reduce information to transfer from your Oracle database). After comparison I even think Oracle is doing an average, not when seconds are at 0 but at 30. I mean between, for example, 14:56:30 and 14:57:30. But to remain simple I have decided to do an average on rounded minutes:
ALTER SESSION SET nls_date_format='dd-mon-yyyy hh24:mi:ss'; SELECT sample_time, cpu/60 AS cpu, bcpu/60 AS bcpu, scheduler/60 AS scheduler, uio/60 AS uio, sio/60 AS sio, concurrency/60 AS concurrency, application/60 AS application, COMMIT/60 AS COMMIT, configuration/60 AS configuration, administrative/60 AS administrative, network/60 AS network, queueing/60 AS queueing, clust/60 AS clust, other/60 AS other FROM (SELECT TRUNC(sample_time,'MI') AS sample_time, DECODE(session_state,'ON CPU',DECODE(session_type,'BACKGROUND','BCPU','ON CPU'), wait_class) AS wait_class FROM v$active_session_history WHERE sample_time>sysdate- INTERVAL '1' HOUR AND sample_time<=TRUNC(SYSDATE,'MI')) ash PIVOT (COUNT(*) FOR wait_class IN ('ON CPU' AS cpu,'BCPU' AS bcpu,'Scheduler' AS scheduler,'User I/O' AS uio,'System I/O' AS sio, 'Concurrency' AS concurrency,'Application' AS application,'Commit' AS COMMIT,'Configuration' AS configuration, 'Administrative' AS administrative,'Network' AS network,'Queueing' AS queueing,'Cluster' AS clust,'Other' AS other)); |
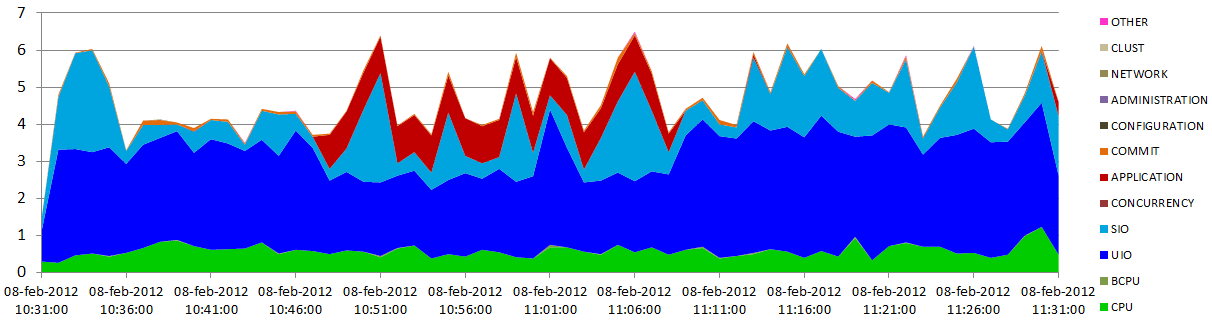
Which produce, under Excel, a pretty good result:
With CPU wait
But if you look closer I’m missing a Grid Control information which is CPU Wait, even if I have CPU breakdown. By the way have you ever realized that CPU Wait information is even not available on a 10g database (at least with a 10g agent, I have not yet tried to upgrade the agent) ?
Finding this information is not piece of cake and I have to thanks Kyle Hailey for his fantastic post on this subject (see references). I used to select ‘CPU used by this session’ from V$SYSSTAT but this table contains figures since instance started, not very useful to have sampled precise information. New available tables are called V$SYSMETRIC and V$SYSMETRIC_HISTORY. V$SYSMETRIC_HISTORY has more history and contains information sampled at different interval (GROUP_ID column, when equal to 3 a sample very 15 seconds with 3 minutes history, when equal to 2 a sample every minute with 1 hour history):
SQL> col metric_name FOR a30 SQL> col METRIC_UNIT FOR a30 SQL> SELECT begin_time,metric_name,VALUE,metric_unit FROM v$sysmetric_history WHERE GROUP_ID=2 AND metric_name LIKE '%CPU%' ORDER BY begin_time DESC; BEGIN_TIME METRIC_NAME VALUE METRIC_UNIT -------------------- ------------------------------ ---------- ------------------------------ 10-feb-2012 16:37:36 Host CPU Utilization (%) 4.40747015 % Busy/(Idle+Busy) 10-feb-2012 16:37:36 CPU Usage Per Sec 99.1352311 CentiSeconds Per SECOND 10-feb-2012 16:37:36 Host CPU Usage Per Sec 141.037579 CentiSeconds Per SECOND 10-feb-2012 16:37:36 DATABASE CPU TIME Ratio 21.9606878 % Cpu/DB_Time 10-feb-2012 16:37:36 Background CPU Usage Per Sec 2.60685068 CentiSeconds Per SECOND 10-feb-2012 16:37:36 CPU Usage Per Txn 1.8055702 CentiSeconds Per Txn 10-feb-2012 16:36:36 Host CPU Utilization (%) 3.96871183 % Busy/(Idle+Busy) 10-feb-2012 16:36:36 CPU Usage Per Sec 89.8532663 CentiSeconds Per SECOND 10-feb-2012 16:36:36 Host CPU Usage Per Sec 126.991518 CentiSeconds Per SECOND 10-feb-2012 16:36:36 DATABASE CPU TIME Ratio 20.2278502 % Cpu/DB_Time 10-feb-2012 16:36:36 Background CPU Usage Per Sec 1.15897888 CentiSeconds Per SECOND . . |
Many interesting figures (‘Host CPU Utilization (%)’ * CPU_COUNT = ‘Host CPU Usage Per Sec’ (cs)) but the one we are looking for is ‘CPU Usage Per Sec’:
SQL> SELECT TRUNC(begin_time,'MI') AS sample_time, VALUE/100 AS cpu_ora_consumed FROM v$sysmetric_history WHERE GROUP_ID=2 AND metric_name='CPU Usage Per Sec'; SAMPLE_TIME CPU_ORA_CONSUMED -------------------- ---------------- 10-feb-2012 17:13:00 .579044014 10-feb-2012 17:12:00 .666609644 10-feb-2012 17:11:00 .608919704 10-feb-2012 17:10:00 .366372564 10-feb-2012 17:09:00 .527227849 10-feb-2012 17:08:00 .615885467 10-feb-2012 17:07:00 .468784569 10-feb-2012 17:06:00 .509915597 10-feb-2012 17:05:00 .594721699 10-feb-2012 17:04:00 .694008114 10-feb-2012 17:03:00 .564496874 . . |
Finally the tricky part is formula for CPU Wait which is difference between CPU demand from sessions (coming from V$ACTIVE_SESSION_HISTORY) and CPU really used by Oracle coming from V$SYSMETRIC_HISTORY. If we settle everything it gives:
SELECT sysmetric_history.sample_time, cpu/60 AS cpu, bcpu/60 AS bcpu, DECODE(SIGN((cpu+bcpu)/60-cpu_ora_consumed), -1, 0, ((cpu+bcpu)/60-cpu_ora_consumed)) AS cpu_ora_wait, scheduler/60 AS scheduler, uio/60 AS uio, sio/60 AS sio, concurrency/60 AS concurrency, application/60 AS application, COMMIT/60 AS COMMIT, configuration/60 AS configuration, administrative/60 AS administrative, network/60 AS network, queueing/60 AS queueing, clust/60 AS clust, other/60 AS other FROM (SELECT TRUNC(sample_time,'MI') AS sample_time, DECODE(session_state,'ON CPU',DECODE(session_type,'BACKGROUND','BCPU','ON CPU'), wait_class) AS wait_class FROM v$active_session_history WHERE sample_time>sysdate-INTERVAL '1' HOUR AND sample_time<=TRUNC(SYSDATE,'MI')) ash PIVOT (COUNT(*) FOR wait_class IN ('ON CPU' AS cpu,'BCPU' AS bcpu,'Scheduler' AS scheduler,'User I/O' AS uio,'System I/O' AS sio, 'Concurrency' AS concurrency,'Application' AS application,'Commit' AS COMMIT,'Configuration' AS configuration, 'Administrative' AS administrative,'Network' AS network,'Queueing' AS queueing,'Cluster' AS clust,'Other' AS other)) ash, (SELECT TRUNC(begin_time,'MI') AS sample_time, VALUE/100 AS cpu_ora_consumed FROM v$sysmetric_history WHERE GROUP_ID=2 AND metric_name='CPU Usage Per Sec') sysmetric_history WHERE ash.sample_time (+)=sysmetric_history.sample_time ORDER BY sample_time; |
Remark:
I use an outer join on V$ACTIVE_SESSION_HISTORY simply because on a not very busy database (so no active sessions) you may have gaps in timestamps. This is obviously not happening in V$SYSMETRIC_HISTORY table.
With Oracle pre 11g
As written above PIVOT keyword is not available in 10g so the query is a bit less groovy:
SELECT sysmetric_history.sample_time, cpu, bcpu, DECODE(SIGN((cpu+bcpu)-cpu_ora_consumed), -1, 0, ((cpu+bcpu)-cpu_ora_consumed)) AS cpu_ora_wait, scheduler, uio, sio, concurrency, application, COMMIT, configuration, administrative, network, queueing, clust, other FROM (SELECT TRUNC(sample_time,'MI') AS sample_time, SUM(DECODE(session_state,'ON CPU',DECODE(session_type,'BACKGROUND',0,1),0))/60 AS cpu, SUM(DECODE(session_state,'ON CPU',DECODE(session_type,'BACKGROUND',1,0),0))/60 AS bcpu, SUM(DECODE(wait_class,'Scheduler',1,0))/60 AS scheduler, SUM(DECODE(wait_class,'User I/O',1,0))/60 AS uio, SUM(DECODE(wait_class,'System I/O',1,0))/60 AS sio, SUM(DECODE(wait_class,'Concurrency',1,0))/60 AS concurrency, SUM(DECODE(wait_class,'Application',1,0))/60 AS application, SUM(DECODE(wait_class,'Commit',1,0))/60 AS COMMIT, SUM(DECODE(wait_class,'Configuration',1,0))/60 AS configuration, SUM(DECODE(wait_class,'Administrative',1,0))/60 AS administrative, SUM(DECODE(wait_class,'Network',1,0))/60 AS network, SUM(DECODE(wait_class,'Queueing',1,0))/60 AS queueing, SUM(DECODE(wait_class,'Cluster',1,0))/60 AS clust, SUM(DECODE(wait_class,'Other',1,0))/60 AS other FROM v$active_session_history WHERE sample_time>sysdate- INTERVAL '1' HOUR AND sample_time<=TRUNC(SYSDATE,'MI') GROUP BY TRUNC(sample_time,'MI')) ash, (SELECT TRUNC(begin_time,'MI') AS sample_time, VALUE/100 AS cpu_ora_consumed FROM v$sysmetric_history WHERE GROUP_ID=2 AND metric_name='CPU Usage Per Sec') sysmetric_history WHERE ash.sample_time (+)=sysmetric_history.sample_time ORDER BY sample_time; |
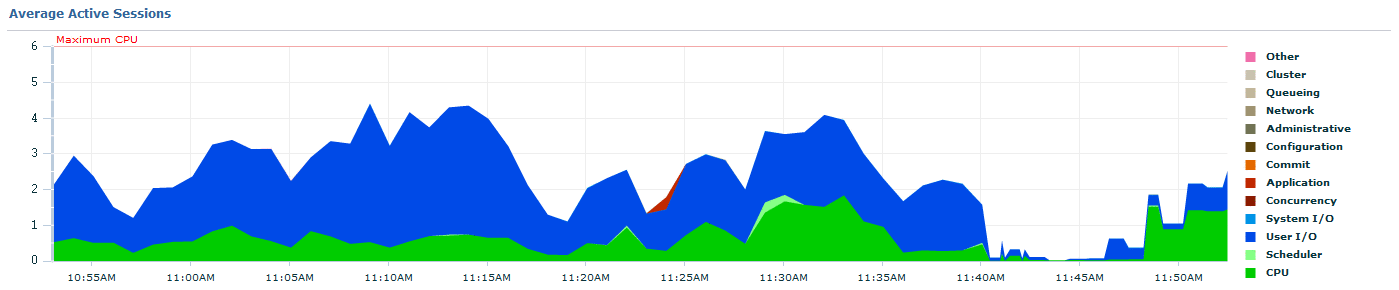
Below a Grid Control example chart of a 10.2.0.4 database with a 10.2.0.5 Oracle Grid Control agent:
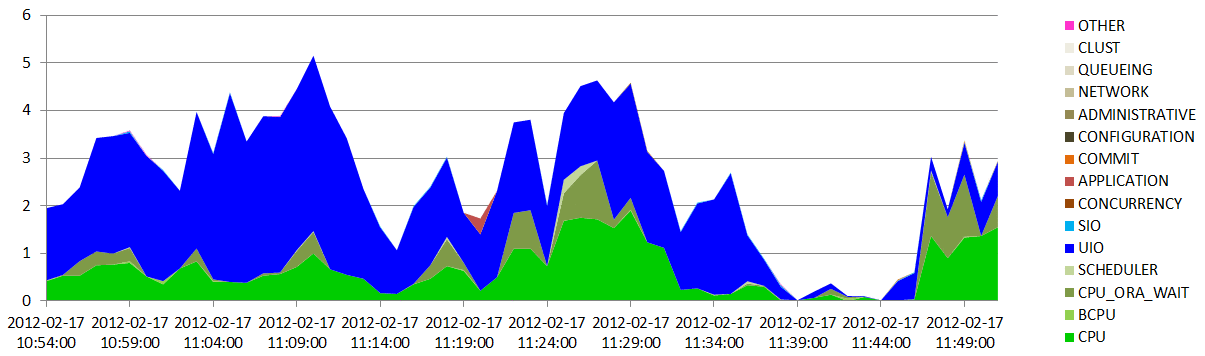
Then with the above query and using Excel I’m able to get more precise information (breakdown of CPU per foreground and background + CPU Wait) like:
Conclusion
Even if all is available in Grid Control it is anyway interesting to find figures by yourself as it clarify myths of how getting them and helps you better understand charts you everyday use.
You can even, same as Grid Control, go deeper in V$ACTIVE_SESSION_HISTORY and filter on EVENT columns to get all Grid Control breakdown charts.
All other remaining charts (I/O, load average,..) will be seen… later on….
References
- Performance Tuning Using Advisors and Manageability Features: AWR, ASH, ADDM and Sql Tuning Advisor [ID 276103.1]


Mary says:
Why did you divide all by 60 in select query?
Yannick Jaquier says:
Because I TRUNC the sample_time column on minutes…
Alex says:
Doubt.
As cpu and bcpu are divided by 60 because of the TRUNC, cpu_ora_consumed shouldn’t be the same way, divided by 60, so that at moment (cpu+bcpu)-cpu_ora_consumed be in minutes?
TRUNC(sample_time,’MI’) AS sample_time,
SUM(DECODE(session_state,’ON CPU’,DECODE(session_type,’BACKGROUND’,0,1),0))/60 AS cpu,
SUM(DECODE(session_state,’ON CPU’,DECODE(session_type,’BACKGROUND’,1,0),0))/60 AS bcpu,
(SELECT
TRUNC(begin_time,’MI’) AS sample_time,
value/100 AS cpu_ora_consumed
DECODE(SIGN((cpu+bcpu)-cpu_ora_consumed), -1, 0, ((cpu+bcpu)-cpu_ora_consumed)) AS cpu_ora_wait,
Yannick Jaquier says:
Alex,
As it is explained in documentation:
Here the TRUNC is just to remove the second part of the sample_time column (to be able to outer join) and I’m not doing any aggregation so no I do not need to divide by 60.
In V$ACTIVE_SESSION_HISTORY we count over a minute period so the need to divide by 60…
Vijay says:
Can you please provide the link
but my question was more of CPU interpretation from your query like wise Concurrency
Yannick Jaquier says:
The link is in reference section…
Vijay says:
Hi Yannick
I ran your query, below are the values for every 1 minute gap how do i interpret the CPU
NUM_CPU = 30
SAMPLE_TIME CPU
*********************** ******
19-APR-2017 09:03:00 PM .70
19-APR-2017 09:04:00 PM 2.48
19-APR-2017 09:05:00 PM 2.77
19-APR-2017 09:06:00 PM 3.20
19-APR-2017 09:07:00 PM 33.68
19-APR-2017 09:08:00 PM 45.63
Yannick Jaquier says:
Hello Vijay,
Read Kyle Hailey’s post this is very well explained here.
What you get is an Average Active Sessions, what we can see is that you system is quite overloaded…
Thanks,
Yannick.
rajesh says:
Hi,
The graph i get on excel doesn’t resemble what i see in OEM. But the post shows the excel graph as a replica of OEM graph. Can you please elaborate the steps of the graph creation.
Thanks,
Rajesh.
Yannick Jaquier says:
Hi,
The easiest is to execute the query (change nls_date_format for your session) in SQL Developer. Then extract the query result as Excel (xlsx).
Open the generated file in Excel and add a new stacked area chart. In the proposed chart you should see the one you target automatically proposed by Excel (I’m using Office 2013).
The remaining part is cosmetic by changing the colors of the series.
Hope it helps.
Thanks,
Yannick.
Luis Santos says:
Yannick, is it possible to create a more “history” version.
I mean to replace V$ACTIVE_SESSION_HISTORY with DBA_HIST_ACTIVE_SESS_HISTORY and V$SYSMETRIC_HISTORY with DBA_HIST_SYSMETRIC_HISTORY.
But seems that DBA_HIST_SYSMETRIC_HISTORY does´t have ‘CPU Usage Per Sec’ metric… 🙁
Yannick Jaquier says:
Luis,
Yes it is possible and I have done it using Highcharts and JQuery !
What I have used in DBA_HIST_ACTIVE_SESS_HISTORY:
Only CPU Wait is not accessible for historical figures… So far ?
Hope it helps,
Yannick.
Juan Zarama says:
Hello
Does anyone have a excel sheet that help me to do a decent graph (could you share it ?)
I’m not an excel expert and my graphics are a mess
Thanks
Yannick Jaquier says:
Hello,
Unfortunately I have not kept mine but it is really not complex to generate: Copy/paste of query result and then insert stacked area chart…
Thanks, Yannick.
Cyrille says:
Hi,
For those like me which don’t have access to the diagnostic pack, there is the following alernative :
http://www.kylehailey.com/ash-masters/
I used my own script based on the work from kyle hailey to build the ash graph and many more things. Bascically v$active_session_history is just historical data from v$session, the only thing you have to do is to make a snapshot every second of your v$session view and store it in a table.
Cyrille
Dilip Patel says:
Hi Yannick,
Is v$active_session_history view part of Tuning pack? Could we use this without license of Management packs ?
Thx
Dilip Patel
Yannick Jaquier says:
Hi Dilip,
Good point ! Diagnostic pack is required to use this view, apparently (not tested) if you have not licensed it the view should be empty:
http://docs.oracle.com/cd/E11882_01/license.112/e47877/options.htm#DBLIC165
You can control this using (we do license Diagnostic+tuning packs where I work):
Thanks, Yannick.
INDRANIL says:
Hi Yannick,
Thank you so much for your prompt reply.
I just wanted to plot last 72 hrs(last 3 days) trend for “session pga memory” vs “session uga memory” ….
I am bit confused …..could you please suggest : which would be the correct one to acomplish this?
##############Query 1 #################################
select ltime,sum(session_pga_memory),sum(session_uga_memory)
from (
SELECT
to_char(s.SAMPLE_TIME,’yyyy-mm-dd-hh24:mi’) ltime
, (select ss.value/1024/1024 from v$sesstat ss, v$statname sn
where ss.sid = s.SESSION_ID and
sn.statistic# = ss.statistic# and
sn.name = ‘session pga memory’) session_pga_memory
, (select ss.value/1024/1024 from v$sesstat ss, v$statname sn
where ss.sid = s.SESSION_ID and
sn.statistic# = ss.statistic# and
sn.name = ‘session uga memory’) session_uga_memory
FROM
DBA_HIST_ACTIVE_SESS_HISTORY s
where s.SAMPLE_TIME between (sysdate -3 ) and sysdate
ORDER BY to_char(s.SAMPLE_TIME,’yyyy-mm-dd-hh24:mi’))
group by ltime
order by ltime
;
########## Query 2 ##############################
select to_char(sn.end_interval_time,’yyyy-mm-dd hh24:mi’) end_time,
(s1.value/1024/1024) session_pga_memory,
(s2.value/1024/1024) session_uga_memory
from
dba_hist_sysstat s1,
dba_hist_sysstat s2,
dba_hist_snapshot sn
where
s1.snap_id = sn.snap_id
and s2.snap_id = sn.snap_id
and s1.stat_name = ‘session pga memory’
and s2.stat_name = ‘session uga memory’
and sn.end_interval_time between (sysdate -3 ) and sysdate
order by to_char(sn.end_interval_time,’yyyy-mm-dd hh24:mi’);
Thanks in advance..
( I am strugling to find out a proper query for this ploting )
From INDRANIL
Yannick Jaquier says:
Hi Indranil,
In query 1 you are mixing live information (V$SESSTAT) and historical information (DBA_HIST_ACTIVE_SESS_HISTORY) so I do not see how it can work…
I’m sure you have noticed that DBA_HIST_SESSTAT does not exists (maybe would be too big/too time consuming to store it)
That’s why I rather prefer your query 2 which is correct in my opinion !
Thanks, Yannick.
INDRANIL says:
Sir, I saw so many posts in the net that to find out the “session uga memory” and “session pga memory” we should not use the tables like dba_hist_sysstat (if I have understood correctly), “For more clarity and close to accurate figure this value should be retrieved from v$sesstat and v$session view periodically. After plotting graph of these observations for fair amount of days, I could analyze the process memory usage more correctly.”
############
But My concern is that – what if we wanted to plot the graphs for last 72 hours trend ? and my DB is restarted becoz of some issues/planned shutdown…then V$session and V$sesstat is get reset… so at that time what to do ?
=> Can I take help from v$active_session_history as below ?
# ###########
I can plot the data by using below query – but will it give us the correct statistics ?
If not correct , then could you please suggest, any other way of ploting the graphs for last hours trends?
#################
select ltime,sum(session_pga_memory),sum(session_uga_memory)
from (
SELECT
to_char(s.SAMPLE_TIME,’yyyy-mm-dd-hh24:mi’) ltime
, (select ss.value/1024/1024 from v$sesstat ss, v$statname sn
where ss.sid = s.SESSION_ID and
sn.statistic# = ss.statistic# and
sn.name = ‘session pga memory’) session_pga_memory
, (select ss.value/1024/1024 from v$sesstat ss, v$statname sn
where ss.sid = s.SESSION_ID and
sn.statistic# = ss.statistic# and
sn.name = ‘session uga memory’) session_uga_memory
FROM
v$active_session_history s
ORDER BY to_char(s.logon_time,’yyyy-mm-dd-hh24:mi’))
group by ltime
order by ltime
;
Yannick Jaquier says:
Hi Indranil,
DBA_HIST_SYSSTAT is, as official documentation says, a snapshot of V$SYSSTAT so I do not see why we should not use it…
If your database has been restarted then for me it’s dead because even V$ACTIVE_SESSION_HISTORY will also be reset at that time…
Thanks, Yannick.
Caesar Dutta says:
I am running Kyles query. The machine is 2 x Dual Core Intel Itanium, running on RHEL 4 for Itanium.
The result I am getting is:
CPU_TOTAL CPU_OS CPU_ORA CPU_ORA_WAIT
———- ———- ———- ————
211.454 0 211.454 0
Please clear my doubts – why is Total CPU so high?
Yannick Jaquier says:
Difficult to say with so few information, seems coming from:
select ‘CPU_ORA_CONSUMED’ CLASS, round(value/100,3) AAS
from v$sysmetric
where metric_name=’CPU Usage Per Sec’
and group_id=2;
Have you divided by 100 ? Unless could be a bug…
Yannick.
Caesar Dutta says:
Dear Yannick:
When I execute the SQL
”
SELECT
TO_CHAR(TRUNC(sample_time,’MI’),’DD-MON-YYYY HH24:MI:SS’) AS sample_time,
SUM(DECODE(session_state,’ON CPU’,DECODE(session_type,’BACKGROUND’,0,1),0))/60 AS cpu,
SUM(DECODE(session_state,’ON CPU’,DECODE(session_type,’BACKGROUND’,1,0),0))/60 AS bcpu
FROM v$active_session_history
WHERE sample_time>sysdate- INTERVAL ‘1’ HOUR
AND sample_time<=TRUNC(SYSDATE,'MI')
GROUP BY TO_CHAR(TRUNC(sample_time,'MI'),'DD-MON-YYYY HH24:MI:SS')
order by 1 asc
"
I am getting the output :
SAMPLE_TIME CPU BCPU
——————– ———- ———-
24-APR-2012 15:12:00 .933333333 0
24-APR-2012 15:13:00 .966666667 0
24-APR-2012 15:14:00 .966666667 0
24-APR-2012 15:15:00 .933333333 0
Now when I use the SQL
"
SELECT
TO_CHAR(TRUNC(begin_time,'MI'),'DD-MON-YYYY HH24:MI:SS') AS sample_time,
VALUE/100 AS cpu_ora_consumed
FROM v$sysmetric_history
WHERE GROUP_ID=2
AND metric_name='CPU Usage Per Sec'
order by 1 asc
"
I am getting
SAMPLE_TIME CPU_ORA_CONSUMED
——————– —————-
24-APR-2012 15:12:00 .823283325
24-APR-2012 15:13:00 .838111459
24-APR-2012 15:14:00 .832590308
24-APR-2012 15:15:00 .854202354
What I am not understanding is that for the sample time 24-APR-2012 15:12:00 the sum of "cpu + bcpu" from the
first query is not equal to .823283325 in the second query.
Please let me know the relation between CPU + BCPU and CPU_ORA_CONSUMED
Thanks in advance, Caesar
Yannick Jaquier says:
Hi Caesar,
This is very well explained in Kyle Hailey’s post.
Thanks, Yannick.
Caesar Dutta says:
Thanks Yannick:
Kyle is using the following tables – V$SYSMETRIC, V$ACTIVE_SESSION_HISTORY (used by you also), and
v$waitclassmetric . But your query contains V$SYSMETRIC_HISTORY and for the wait event you are also
using V$ACTIVE_SESSION_HISTORY . So I am confused.
As per your recco I will use Kyle’s SQL then from http://dboptimizer.com/2011/07/21/oracle-cpu-time/
Thanks again.
Caesar Dutta says:
Thanks very much. I agree that it is better to look at OS level using TOP command etc. I will write the SQL for
Memory / CPU utilisation and post it here.
Caesar Dutta says:
Dear Yannick:
Sorry I forgot to mention in my earlier post “April 23, 2012 at 07:59 “. The V$PROCESS_MEMORY is a
breakdown of PGA. The integrated PGA allocated can be obtained from V$PROCESS. But what about SGA. It is also
consumimg memory is it not??
My point is that – suppose my system has 16GB of physical RAM. Then what %age is used by PGA+SGA? though I am missing UGA.
Now an interesting fact. The system may have 16GBRAM. Then there is the virtual memory also “Page file” which
may further complicate matter.
Thanks in advance — Caesar
Yannick Jaquier says:
Hi Caesar,
First let me tell you that I prefer OS tool to measure what processes are really using (memory, cpu,…).
I don’t know what you really want to measure but what you are looking for is set by either SGA_MAX_TARGET or MEMORY_MAX_TARGET.
Finally UGA can be get from V$SESSTAT but it is either part of PGA or SGA (dedicated/shared server mode). Hope it helps…
Thanks, Yannick.
Caesar Dutta says:
Dear Yannick:
First a wonderful post and thanks so much for your kind attention.
Just one clarification.
From your SQL above
– please clarify that “%CPU used by an instance is SUM TOTAL OF ‘CPU’ and ‘BCPU’. I should not consider the
waiting processes – as they are not yet utilizing the CPU”.
Warm regards,
Caesar
Yannick Jaquier says:
Hi Caesar,
Yes, I would not add CPU Wait as when you are waiting for CPU you actually do not use it.. 🙂
Thanks, Yannick.
Caesar Dutta says:
Dear Sir:
I want to capture %age of memory and cpu used by an Oracle database instance (PMON, SMON, DBWR, ARCHR,
LGWR, Sql processes, waits, jobs etc etc). I want to capture this snapshot every hour.
Please guide me with SQLs.
Thanks in advance
caesar
Yannick Jaquier says:
Hello Caesar,
CPU used by instance is described in this post. Then for instance memory usage I would use V$PROCESS_MEMORY. Then with 2 SQL statements spooling in a file and a OS scheduler (cron, ..) you should be able to obtain what you target.
Thanks, Yannick.