Table of contents
Preamble
While reviewing OCM exam objectives I saw that AWR baselines are in to-be-known list…. So decided to have a quick look and at same time understand this SYSTEM_MOVING_WINDOW default baseline that appears in Grid/Cloud Control.
As you can read in blogs of well known Oracle worldwide experts (few references below), increasing performance of an Oracle database is all about reducing DB time metric (that you can find in AWR reports). As a DBA I have quite often been in front of internal customers stating: performance of database were good, we did not change anything and now performance are awful, please correct problem as soon as possible…. I’m sure most of you have faced this in their DBA life…
So come in loop AWR baselines that are really great and can save your day !
For the test case I create the below table and fill it with 10,000 rows:
DROP TABLE test1; CREATE TABLE test1(id NUMBER, descr VARCHAR(200)) TABLESPACE users; DECLARE i NUMBER; nbrows NUMBER; BEGIN i:=1; nbrows:=10000; LOOP EXIT WHEN i>nbrows; INSERT INTO test1 VALUES(i,TO_CHAR(TO_DATE(i,'j'), 'jsp')); i:=i+1; END LOOP; COMMIT; END; / EXEC DBMS_STATS.GATHER_TABLE_STATS(ownname=>'yjaquier', tabname=>'test1', estimate_percent=>NULL, method_opt=>'FOR ALL INDEXED COLUMNS SIZE AUTO', degree=>DBMS_STATS.DEFAULT_DEGREE, CASCADE=>TRUE); |
Modus operandi will be multiple select on this TEST1 table using a PL/SQL block, then I will multiply by 10 number of rows in this table and run same PL/SQL block and finally run an optimized (to be proven) PL/SQL block. This is symptomatic of a newly created application that starts with very few rows and get bigger when users fill-in information…
Testing has been done using Oracle Enterprise 11.2.0.3 running on a 16 cores box (not dedicated) with Red Hat Enterprise Linux Server release 5.5 (Tikanga). For testing purpose I have reduced AWR frequency to its minimum i.e. 10 minutes.
Good performance
The PL/SQL block I aim to use is the following. You will notice the hard parsing as no bind variable and as many select as number of rows in TEST1 table that has no indexes:
DECLARE /* Yannick */ i NUMBER; sql_stmt VARCHAR2(200); max_id NUMBER; BEGIN SELECT MAX(id) INTO max_id FROM yjaquier.test1; DBMS_RANDOM.SEED(SYSDATE); FOR i IN 1..max_id LOOP sql_stmt:='SELECT /* Yannick */ descr FROM yjaquier.test1 WHERE id=' || ROUND(DBMS_RANDOM.VALUE(1,max_id)); EXECUTE IMMEDIATE sql_stmt; END LOOP; END; / |
With 10,000 rows in the table the PL/SQL block is executed in 39.83 seconds, I take a baseline using below command:
SQL> EXEC DBMS_WORKLOAD_REPOSITORY.CREATE_BASELINE(13264,13265,'Good performance'); PL/SQL PROCEDURE successfully completed. SQL> SELECT baseline_id,baseline_name,baseline_type,start_snap_id,end_snap_id FROM dba_hist_baseline; BASELINE_ID BASELINE_NAME BASELINE_TYPE START_SNAP_ID END_SNAP_ID ----------- ---------------------------------------------------------------- ------------- ------------- ----------- 2 Good performance STATIC 13264 13265 0 SYSTEM_MOVING_WINDOW MOVING_WINDOW 13237 13265 |
The user created baselines are of type STATIC, versus the default SYSTEM_MOVING_WINDOW baselines that is of type MOVING. Windows moving size is in DBA_HIST_BASELINE.MOVING_WINDOW_SIZE column and alterable with DBMS_WORKLOAD_REPOSITORY.MODIFY_BASELINE_WINDOW_SIZE procedure. Even using baseline templates it is not possible to create a new moving window baseline.
The baseline template helps you, for example, to create a repeating baselines (every Monday between 8 AM and 8 PM for example), their type will be GENERATED. DBA_HIST_BASELINE_DETAILS, DBA_HIST_BASELINE_METADATA and DBA_HIST_BASELINE_TEMPLATE view display all details of baselines and templates.
The moving baseline aim is to compare how performance of your database evolve over time, in other words is your performance going in right or wrong direction ?
You can display baselines statistics and metric using the two below procedures of DBMS_WORKLOAD_REPOSITORY package:
SQL> SET lines 200 pages 1000 SQL> SELECT metric_name, metric_unit, average, minimum, maximum FROM TABLE(DBMS_WORKLOAD_REPOSITORY.SELECT_BASELINE_METRIC('Good performance')) ORDER BY metric_name; METRIC_NAME METRIC_UNIT AVERAGE MINIMUM MAXIMUM ---------------------------------------------------------------- ---------------------------------------------------------------- ---------- ---------- ---------- Active Parallel Sessions Sessions 0 0 0 Active Serial Sessions Sessions 1.35 0 3 Average Active Sessions Active Sessions .185770022 0 .903106368 Average Synchronous Single-Block Read Latency Milliseconds 2.65291323 0 8.22211738 Background CPU Usage Per Sec CentiSeconds Per SECOND .914520922 0 6.01504323 Background Checkpoints Per Sec CHECK Points Per SECOND 0 0 0 Background TIME Per Sec Active Sessions .029696648 0 .217157599 Branch Node Splits Per Sec Splits Per SECOND 0 0 0 Branch Node Splits Per Txn Splits Per Txn 0 0 0 Buffer Cache Hit Ratio % (LogRead - PhyRead)/LogRead 98.6432958 0 100 CPU Usage Per Sec CentiSeconds Per SECOND 3.39302187 0 9.67427669 . . . SQL> SELECT * FROM TABLE(DBMS_WORKLOAD_REPOSITORY.SELECT_BASELINE_DETAILS(2)); DBID BASELINE_ID INSTANCE_NUMBER START_SNAP_ID START_SNAP_TIME END_SNAP_ID ---------- ----------- --------------- ------------- --------------------------------------------------------------------------- ----------- END_SNAP_TIME SHU ERROR_COUNT PCT_TOTAL_TIME --------------------------------------------------------------------------- --- ----------- -------------- 3673847771 2 1 13264 07-MAY-13 10.10.37.940 AM 13265 07-MAY-13 10.20.38.541 AM NO 0 100 |
Bad performance
Then I now fill (using same method) the TEST1 table with 1,000,000 rows and I execute the exact same PL/SQL block that now elapses in 8 minutes and 40.70 seconds. I create a new baseline that I call ‘Bad performance’:
SQL> EXEC DBMS_WORKLOAD_REPOSITORY.CREATE_BASELINE(13266,13267,'Bad performance'); PL/SQL PROCEDURE successfully completed. SQL> SELECT baseline_id,baseline_name,baseline_type,start_snap_id,end_snap_id FROM dba_hist_baseline; BASELINE_ID BASELINE_NAME BASELINE_TYPE START_SNAP_ID END_SNAP_ID ----------- ---------------------------------------------------------------- ------------- ------------- ----------- 2 Good performance STATIC 13264 13265 3 Bad performance STATIC 13266 13267 0 SYSTEM_MOVING_WINDOW MOVING_WINDOW 13237 13267 |
To compare the two baselines you have multiple option DBMS_WORKLOAD_REPOSITORY.AWR_DIFF_REPORT_HTML, DBMS_WORKLOAD_REPOSITORY.AWR_DIFF_REPORT_TEXT or awrddrpt.sql script located in $ORACLE_HOME/rdbms/admin directory. I prefer to use awrddrpt.sql script and display result in my web browser:
So what do we see (non exhaustively) ?:
- DB time moved from 2.2 (min) to 9.7 (min) over a 10 minutes period.
- Top 5 wait events move from I/O waits (db file sequential read & direct path read) to CPU at more than 91%.
- parse time elapsed, DB CPU and hard parse elapsed time have increased a lot.
- sql_id 81uvdbt46vt5p (my PL/SQL block, thanks to /* Yannick */ comment to retrieve it) is the one that has most been impacted between the two periods (% of DB time, elapsed time, CPU time, …).
So clearly something has changed and you can peacefully forward to applicative team and move to something else… But as a good DBA you may, as well, have a look…
Performance improved
To try to optimize the PL/SQL code I create an index on id column:
CREATE INDEX test1_idx_id ON test1(id) TABLESPACE users; EXEC DBMS_STATS.GATHER_TABLE_STATS(ownname=>'yjaquier', tabname=>'test1', estimate_percent=>NULL, method_opt=>'FOR ALL INDEXED COLUMNS SIZE AUTO', degree=>DBMS_STATS.DEFAULT_DEGREE, CASCADE=>TRUE); |
And remove the hard coded value by using a bind variable:
DECLARE /* Yannick */ i NUMBER; sql_stmt VARCHAR2(200); max_id NUMBER; BEGIN SELECT MAX(id) INTO max_id FROM yjaquier.test1; DBMS_RANDOM.SEED(SYSDATE); sql_stmt:='SELECT /* Yannick */ descr FROM yjaquier.test1 WHERE id=:id'; FOR i IN 1..max_id LOOP EXECUTE IMMEDIATE sql_stmt USING ROUND(DBMS_RANDOM.VALUE(1,max_id)); END LOOP; END; / |
The PL/SQL block is now executed in 24.50 seconds. I create a new baseline called ‘Performance improved’:
SQL> EXEC DBMS_WORKLOAD_REPOSITORY.CREATE_BASELINE(13268,13269,'Performance improved'); PL/SQL PROCEDURE successfully completed. SQL> SELECT baseline_id,baseline_name,baseline_type,start_snap_id,end_snap_id FROM dba_hist_baseline; BASELINE_ID BASELINE_NAME BASELINE_TYPE START_SNAP_ID END_SNAP_ID ----------- ---------------------------------------------------------------- ------------- ------------- ----------- 2 Good performance STATIC 13264 13265 3 Bad performance STATIC 13266 13267 4 Performance improved STATIC 13268 13269 0 SYSTEM_MOVING_WINDOW MOVING_WINDOW 13238 13269 |
The comparison report is the following:
So what do we see (non exhaustively) ?:
- DB time moved from 9.7 (min) to 2.9 (min) over a 10 minutes period.
- Top 5 wait events move from CPU at more than 91% to I/O waits (db file sequential read & direct path read).
- parse time elapsed, DB CPU and hard parse elapsed time have decreased a lot.
- sql_id 81uvdbt46vt5p load (% of DB time, elapsed time, CPU time, …) has decreased because not present in third run (performance improved) you would say… But we can retrieve improved PL/SQL sql_id, again, using /* Yannick */ comment and now see it is 28ja91pnth38j. By comparing we can see that main performance indicator (% of DB time, elapsed time, CPU time, …) have decreased.
This sql_id change also demonstrate, was it needed to re-demonstrate it ?, that checking performance improvement, or not, is not always a piece of cake…
Conclusion
All can also be seen graphically in Cloud Control at a very high level but comparing period and keeping baselines is best way to be able to go in details:
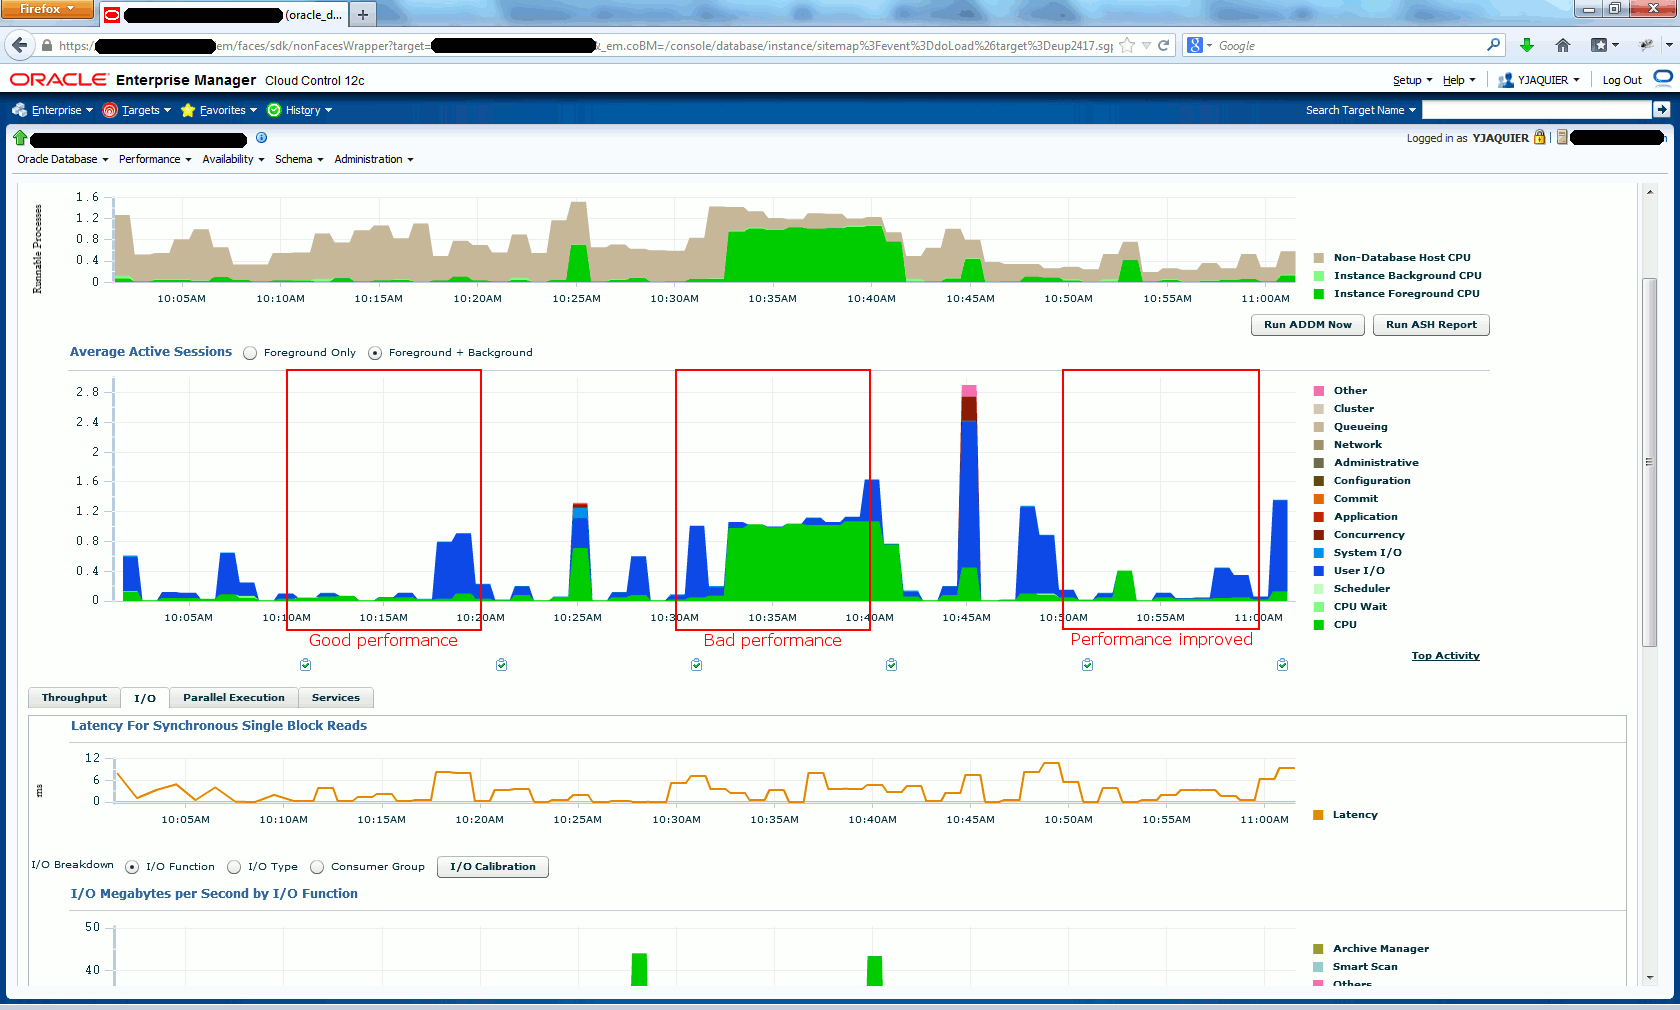
As a DBA I would always keep a baseline when users are happy with performance. This would provide invaluable piece of information when things start to go wrong and that you need to prove from where are coming problems…
For the fun I have generated the comparison report between good performance and performance improved baselines:
Without entering too much in details we can see that even with a 10 times more figures the performance globally is almost flat, I would love achieve it for all our environments…
References
- AWR Baseline Enhancements in Oracle Database 11g Release 1
- Back to Basics: DB Time Performance Tuning: Theory and Practice
- Evidence for successful #Oracle Performance Tuning