In my daily third level support activity I often need to generate performance report like Automatic Workload Repository (AWR), Automatic Database Diagnostic Monitor (ADDM) and Active Session History (ASH).
Almost all DBAs have the habit to use awrrpt.sql, addmrpt.sql and ashrpt.sql scripts located in $ORACLE_HOME/rdbms/admin directory. This is even the recommended way to go by Oracle !
Problem is that for security reason (firewalls and all) it is very complex for me to get an SSH access to the database servers. The maximum I can get is an account with DBA role to perform my checks (not too bad).
So let’s see how you can generate all these reports without the Linux/Unix access to the database server.
Worth mentioning that AWR, ADDM and ASH require Oracle Diagnostics Pack paid option !
All the queries have been executed with SQLcl on a 19c Enterprise Edition database (19.29), but it does apply to 26ai and up…
Automatic Database Diagnostic Monitor (ADDM)
For almost all reports there is a bunch of setting that help to have a better display:
set long 1000000
set longchunksize 32767
set linesize 32767
set pagesize 10000
set trimspool on
set feedback off
It is also interesting to change the default date format if you have the default with:
alter session set nls_date_format='dd-mon-yyyy hh24:mi:ss';
select current_date from dual;
Get the ADDM task previous run with something like (tune the number of fetched rows and set a end_time in below query):
SQL> select
       task_name,
       description,
       status,
       begin_snap_id,
       end_snap_id,
       round((cast(end_time as date) - cast(begin_time as date)) * 24 * 60 * 60) as duration_seconds,
       database_time,
       active_sessions
     from dba_addm_tasks
     order by created desc
     fetch first 20 rows only;

TASK_NAME                DESCRIPTION                                                                  STATUS          BEGIN_SNAP_ID    END_SNAP_ID    DURATION_SECONDS    DATABASE_TIME    ACTIVE_SESSIONS
________________________ ____________________________________________________________________________ ____________ ________________ ______________ ___________________ ________________ __________________
ADDM:1984200506_1_949    ADDM auto run: snapshots [948, 949],  instance 1,  database id 1984200506    COMPLETED                 948            949                3621     163256344700              45,09
ADDM:1984200506_1_948    ADDM auto run: snapshots [947, 948],  instance 1,  database id 1984200506    COMPLETED                 947            948                3555      63247775624              17,79
ADDM:1984200506_1_947    ADDM auto run: snapshots [946, 947],  instance 1,  database id 1984200506    COMPLETED                 946            947                3613     151153763249              41,84
ADDM:1984200506_1_946    ADDM auto run: snapshots [945, 946],  instance 1,  database id 1984200506    COMPLETED                 945            946                3615      25859235018               7,15
ADDM:1984200506_1_945    ADDM auto run: snapshots [944, 945],  instance 1,  database id 1984200506    COMPLETED                 944            945                3613      16746900100               4,64
ADDM:1984200506_1_944    ADDM auto run: snapshots [943, 944],  instance 1,  database id 1984200506    COMPLETED                 943            944                3570    2418713585640             677,51
ADDM:1984200506_1_943    ADDM auto run: snapshots [942, 943],  instance 1,  database id 1984200506    COMPLETED                 942            943                3576    1584476560602             443,09
ADDM:1984200506_1_942    ADDM auto run: snapshots [941, 942],  instance 1,  database id 1984200506    COMPLETED                 941            942                3619     163847971000              45,27
ADDM:1984200506_1_941    ADDM auto run: snapshots [940, 941],  instance 1,  database id 1984200506    COMPLETED                 940            941                3623     130358935847              35,98
ADDM:1984200506_1_940    ADDM auto run: snapshots [939, 940],  instance 1,  database id 1984200506    COMPLETED                 939            940                3569     436144411227              122,2
ADDM:1984200506_1_939    ADDM auto run: snapshots [938, 939],  instance 1,  database id 1984200506    COMPLETED                 938            939                3626     270171022207              74,51
ADDM:1984200506_1_938    ADDM auto run: snapshots [937, 938],  instance 1,  database id 1984200506    COMPLETED                 937            938                3565    2609721164748             732,04
ADDM:1984200506_1_937    ADDM auto run: snapshots [936, 937],  instance 1,  database id 1984200506    COMPLETED                 936            937                3630      83728902834              23,07
ADDM:1984200506_1_936    ADDM auto run: snapshots [935, 936],  instance 1,  database id 1984200506    COMPLETED                 935            936                3592     106358238379              29,61
ADDM:1984200506_1_935    ADDM auto run: snapshots [934, 935],  instance 1,  database id 1984200506    COMPLETED                 934            935                3594     334607105644               93,1
ADDM:1984200506_1_934    ADDM auto run: snapshots [933, 934],  instance 1,  database id 1984200506    COMPLETED                 933            934                3625     755308522314             208,36
ADDM:1984200506_1_933    ADDM auto run: snapshots [932, 933],  instance 1,  database id 1984200506    COMPLETED                 932            933                3558     116115104428              32,63
ADDM:1984200506_1_932    ADDM auto run: snapshots [931, 932],  instance 1,  database id 1984200506    COMPLETED                 931            932                3618     114790744324              31,73
ADDM:1984200506_1_931    ADDM auto run: snapshots [930, 931],  instance 1,  database id 1984200506    COMPLETED                 930            931                3617     113986287922              31,51
ADDM:1984200506_1_930    ADDM auto run: snapshots [929, 930],  instance 1,  database id 1984200506    COMPLETED                 929            930                3619     209418845571              57,87
Get the header of the classical ADDM report with (DBA_ADDM_FINDINGS):
SQL> select
       finding_name || ' (' || type || ')' as finding_name,
       message || ' (' || more_info || ')' as message,
       active_sessions,
       perc_active_sess
     from dba_addm_findings a
     where a.task_name='ADDM:1984200506_1_756'
     and a.parent = 0
     and impact_type is not null
     order by nvl(a.perc_active_sess,0) desc;

FINDING_NAME                              MESSAGE                                                                                                                                                                          ACTIVE_SESSIONS    PERC_ACTIVE_SESS
_________________________________________ _____________________________________________________________________________________________________________________________________________________________________________ __________________ ___________________
Top SQL Statements (PROBLEM)              SQL statements consuming significant database time were found. These statements offer a good opportunity for performance improvement. ()                                                   10,01               46,08
PL/SQL Execution (PROBLEM)                PL/SQL execution consumed significant database time. ()                                                                                                                                     4,28               19,69
Unusual "Network" Wait Event (PROBLEM)    Wait event "TCP Socket (KGAS)" in wait class "Network" was consuming significant database time. ()                                                                                          2,33               10,73
Unusual "Network" Wait Event (PROBLEM)    Wait event "SQL*Net message from dblink" in wait class "Network" was consuming significant database time. ()                                                                                1,71                7,86
Unusual "Network" Wait Event (PROBLEM)    Wait event "SQL*Net more data from dblink" in wait class "Network" was consuming significant database time. ()                                                                              0,72                 3,3
Shared Pool Latches (SYMPTOM)             Contention for latches related to the shared pool was consuming significant database time. (Waits for "cursor: pin S wait on X" amounted to 1% of database time.)                           0,56                2,57
I/O to Temporary Tablespaces (PROBLEM)    Waits for I/O to temporary tablespaces were consuming significant database time. (The value of parameter "pga_aggregate_target" was "20096 M" during the analysis period.)                  0,43                1,97
Enter in the detail, like in the classical ADDM report, with DBA_ADVISOR_RECOMMENDATIONS and DBA_ADVISOR_ACTIONS. The query is a bit complex but I have tried to display exactly what we get in the classical ADDM report:
SQL> with findings as (select row_number() over (order by nvl(perc_active_sess,0) desc) as fake_id, finding_id, finding_name from dba_addm_findings where task_name = 'ADDM:1984200506_1_756' and parent = 0 order by nvl(perc_active_sess,0) desc),
     recommendations as (select row_number() over (partition by finding_id order by benefit desc) as fake_id, finding_id, rec_id, benefit from dba_advisor_recommendations where task_name = 'ADDM:1984200506_1_756' order by finding_id, benefit desc),
     total_db_time_us as (select avg(impact * 100 / nullif(perc_active_sess, 0)) as total_db_time_us from dba_addm_findings where task_name = 'ADDM:1984200506_1_756' and parent = 0 and nvl(perc_active_sess, 0) > 0), -- One row for totol db time in microseconds
     snapshot_duration as (select (cast(end_time as date) - cast(begin_time as date)) * 24 * 60 * 60 as duration_seconds from dba_addm_tasks where task_name = 'ADDM:1984200506_1_756') -- One row for snapshot duration in seconds
     select
       --findings.*, recommendations.*, b.*
       findings.finding_name,
       recommendations.rec_id,
       --daa.message,
       replace(daa.message, '. ', '.' || chr(10)) as message,
       round(recommendations.benefit/(1000000 * snapshot_duration.duration_seconds), 2) as est_benefit_act_sess,
       round(recommendations.benefit/total_db_time_us.total_db_time_us * 100, 2) as est_benefit_total_act_perc
     from findings, recommendations, dba_advisor_actions daa, total_db_time_us, snapshot_duration
     where daa.task_name='ADDM:1984200506_1_756'
     and recommendations.rec_id = daa.rec_id
     and recommendations.finding_id = findings.finding_id
     order by findings.fake_id, recommendations.fake_id;

FINDING_NAME                       REC_ID MESSAGE                                                                                                                                         EST_BENEFIT_ACT_SESS    EST_BENEFIT_TOTAL_ACT_PERC
_______________________________ _________ ____________________________________________________________________________________________________________________________________________ _______________________ _____________________________
Top SQL Statements                     22 Run SQL Tuning Advisor on the SELECT statement with SQL_ID "50wht8vbjdmy3".                                                                                     3,69                         16,98
Top SQL Statements                     21 Run SQL Tuning Advisor on the INSERT statement with SQL_ID "bkbbrwhhjg9n1".                                                                                     2,92                         13,45
Top SQL Statements                     23 Investigate the PL/SQL statement with SQL_ID "4jjsuqhxrgnp7" for possible performance improvements.                                                             1,02                          4,67
                                          You can supplement the information given here with an ASH report for this SQL_ID.
Top SQL Statements                     24 Investigate the SELECT statement with SQL_ID "cgtkbw2chxj7f" for possible performance improvements.                                                             0,79                          3,62
                                          You can supplement the information given here with an ASH report for this SQL_ID.
Top SQL Statements                     25 Run SQL Tuning Advisor on the SELECT statement with SQL_ID "6wtxcthv14zjn".                                                                                     0,74                          3,42
PL/SQL Execution                       16 Tune the entry point PL/SQL "FPSAPP.SCH_QUEUE_MGR_SERVICE.CALL_SCHEDULER" of type "PACKAGE" and ID 51684.                                                       2,33                         10,74
                                          Refer to the PL/SQL documentation for addition information.
PL/SQL Execution                       17 Tune the entry point PL/SQL "FPSADMIN.ADM_LOAD_DWH" of type "PROCEDURE" and ID 50894.                                                                           1,17                          5,39
                                          Refer to the PL/SQL documentation for addition information.
PL/SQL Execution                       18 Tune the entry point PL/SQL "FPSADMIN.CHK_ALL_TO_TABLE" of type "FUNCTION" and ID 50803.                                                                         0,7                          3,23
                                          Refer to the PL/SQL documentation for addition information.
PL/SQL Execution                       19 Tune the entry point PL/SQL "FPSAPP.SCH_SNAPSHOT_SERVICE.SAVE_QUEUE_TIMERS" of type "PACKAGE" and ID 51672.                                                     0,04                          0,19
                                          Refer to the PL/SQL documentation for addition information.
PL/SQL Execution                       20 Tune the entry point PL/SQL "FPSADMIN.TIMESTAMP_DELTA_SEC" of type "FUNCTION" and ID 50864.                                                                     0,03                          0,15
                                          Refer to the PL/SQL documentation for addition information.
Unusual "Network" Wait Event            2 Investigate the cause for high "TCP Socket (KGAS)" waits.                                                                                                       2,33                         10,73
                                          Refer to Oracle's "Database Reference" for the description of this wait event.
Unusual "Network" Wait Event            5 Investigate the cause for high "TCP Socket (KGAS)" waits with P1,P2,P3 (" ,  ,  ") values "6", "0" and "0" respectively.                                        2,33                         10,73
Unusual "Network" Wait Event            4 Investigate the cause for high "TCP Socket (KGAS)" waits in Service "SYS$USERS".                                                                                2,33                         10,73
Unusual "Network" Wait Event            3 Investigate the cause for high "TCP Socket (KGAS)" waits in Module "DBMS_SCHEDULER".                                                                            2,33                         10,73
Unusual "Network" Wait Event            8 Investigate the cause for high "SQL*Net message from dblink" waits in Service "SYS$USERS".                                                                      1,71                          7,86
Unusual "Network" Wait Event            6 Investigate the cause for high "SQL*Net message from dblink" waits.                                                                                             1,71                          7,86
                                          Refer to Oracle's "Database Reference" for the description of this wait event.
Unusual "Network" Wait Event            6 Look at the "Top SQL Statements" finding for SQL statements consuming significant time on the "SQL*Net message from dblink" wait event.                         1,71                          7,86
                                          For example, the PL/SQL statement with SQL_ID "4jjsuqhxrgnp7" is responsible for 59% of these waits.
Unusual "Network" Wait Event            9 Investigate the cause for high "SQL*Net message from dblink" waits with P1 ("driver id") value "0" and P2 ("#bytes") value "1".                                 1,63                          7,51
Unusual "Network" Wait Event            7 Investigate the cause for high "SQL*Net message from dblink" waits in Module "DBMS_SCHEDULER".                                                                  1,63                          7,51
Unusual "Network" Wait Event           10 Investigate the cause for high "SQL*Net more data from dblink" waits.                                                                                           0,72                           3,3
                                          Refer to Oracle's "Database Reference" for the description of this wait event.
Unusual "Network" Wait Event           10 Look at the "Top SQL Statements" finding for SQL statements consuming significant time on the "SQL*Net more data from dblink" wait event.                       0,72                           3,3
                                          For example, the SELECT statement with SQL_ID "cgtkbw2chxj7f" is responsible for 87% of these waits.
Unusual "Network" Wait Event           11 Investigate the cause for high "SQL*Net more data from dblink" waits in Module "DBMS_SCHEDULER".                                                                0,72                           3,3
Unusual "Network" Wait Event           12 Investigate the cause for high "SQL*Net more data from dblink" waits in Service "SYS$USERS".                                                                    0,72                           3,3
Unusual "Network" Wait Event           13 Investigate the cause for high "SQL*Net more data from dblink" waits with P1 ("driver id") value "0" and P2 ("#bytes") value "1".                               0,16                          0,74
Shared Pool Latches                     1 Investigate the cause for latch contention using the given blocking sessions or modules.                                                                        0,56                          2,57
I/O to Temporary Tablespaces           14 Look at the "Top SQL Statements" finding for SQL statements consuming significant I/O on temporary tablespaces.                                                 0,43                          1,97
I/O to Temporary Tablespaces           15 Increase the size of the PGA by setting the value of parameter "pga_aggregate_target" to 24000 M.                                                               0,34                          1,57
We can dig into details with DBA_ADVISOR_RATIONALE:
SQL> select
       impact_type,
       replace(message, '. ', '.' || chr(10)) as message
     from dba_advisor_rationale
     where task_name='ADDM:1984200506_1_756'
     and rec_id = 22;

IMPACT_TYPE                       MESSAGE
_________________________________ _______________________________________________________________________________________________________________________________________________
Database time in microseconds.    The SQL spent 100% of its database time on CPU, I/O and Cluster waits.
                                  This part of database time may be improved by the SQL Tuning Advisor.
Database time in microseconds.    Database time for this SQL was divided as follows: 97% for SQL execution, 0% for parsing, 3% for PL/SQL execution and 0% for Java execution.
Database time in microseconds.    SQL statement with SQL_ID "50wht8vbjdmy3" was executed 1287 times and had an average elapsed time of 10 seconds.
You even get the SQL text of each sql_id with DBA_ADVISOR_OBJECTS (or DBA_HIST_SQLxxxx views):
select
  adv_sql_id, --attr1
  attr4
from dba_advisor_objects
where task_name='ADDM:1984200506_1_756';
But digging too much you start to re-generate what Oracle has already done with DBMS_ADVISOR.GET_TASK_REPORT. You can obviously spool in a text file to read the result in a text editor:
SQL> select dbms_advisor.get_task_report(
       task_name  => 'ADDM:1984200506_1_756',
       type       => 'TEXT',
       level      => 'ALL',
       section    => 'ALL',
       owner_name => 'SYS'
     ) as addm_report
     from dual;

ADDM_REPORT
___________________________________________________________________________________________________________________________
          ADDM Report for Task 'ADDM:1984200506_1_756'
          --------------------------------------------

Analysis Period
---------------
AWR snapshot range from 755 to 756.
Time period starts at 28/06/26 13:00:22
Time period ends at 28/06/26 14:00:39
.
.
.
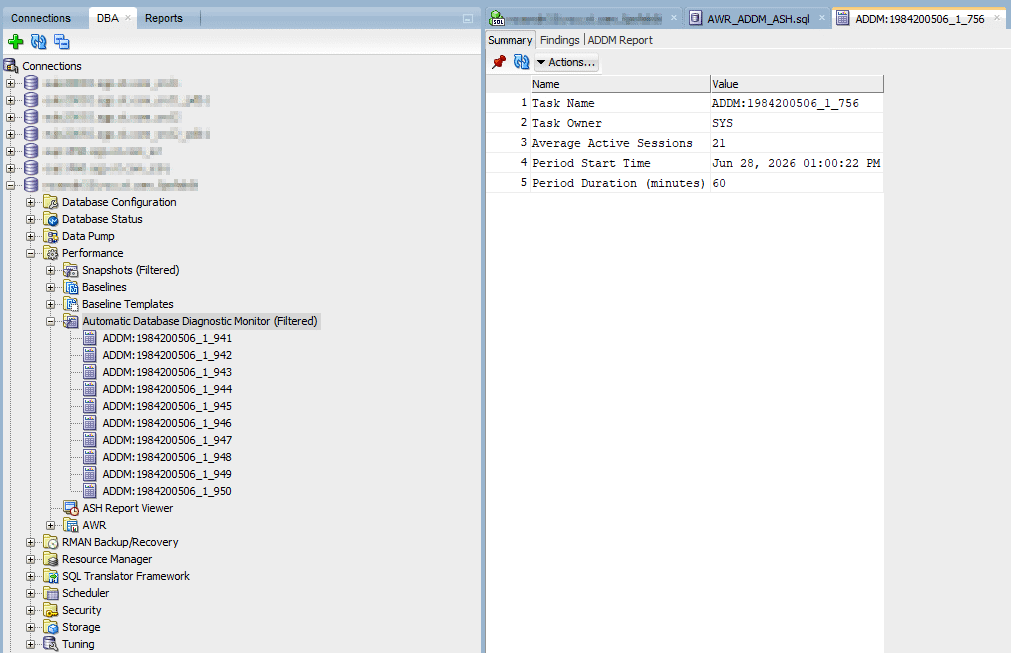
You have also a graphical interface in Java version of SQL Developer, in DBA tab with Automatic Database Diagnostic Monitor:
addm_report_viewer01
Active Session History (ASH)
For ASH report the procedure is DBMS_WORKLOAD_REPOSITORY.ASH_REPORT_HTML (or DBMS_WORKLOAD_REPOSITORY.ASH_REPORT_TEXT).
You might need the database ID (DBID) and instance number:
SQL> select dbid from v$database;

         DBID
_____________
   1984200506
SQL> select instance_number from v$instance;

   INSTANCE_NUMBER
__________________
                 1
You obviously need to understand what’s still available in memory and in history table with:
Finally generate the report for an available period (spool the result in an HTML file):
SQL> select * from table(dbms_workload_repository.ash_report_html(
       l_dbid     => (select dbid from v$database),
       l_inst_num => (select instance_number from v$instance),
       l_btime    =>  to_date('28-jun-2026 13:00:00','DD-MON-YYYY HH24:MI:SS'),
       l_etime    => to_date('28-jun-2026 14:00:00','DD-MON-YYYY HH24:MI:SS')
     ));

OUTPUT
____________________________________________________________________________________________________________________________________
<html lang="en"><head><title>ASH Report - From 28-Jun-26 13:00:00 To 28-Jun-26 14:00:00</title>
<style type="text/css">
.
.
.
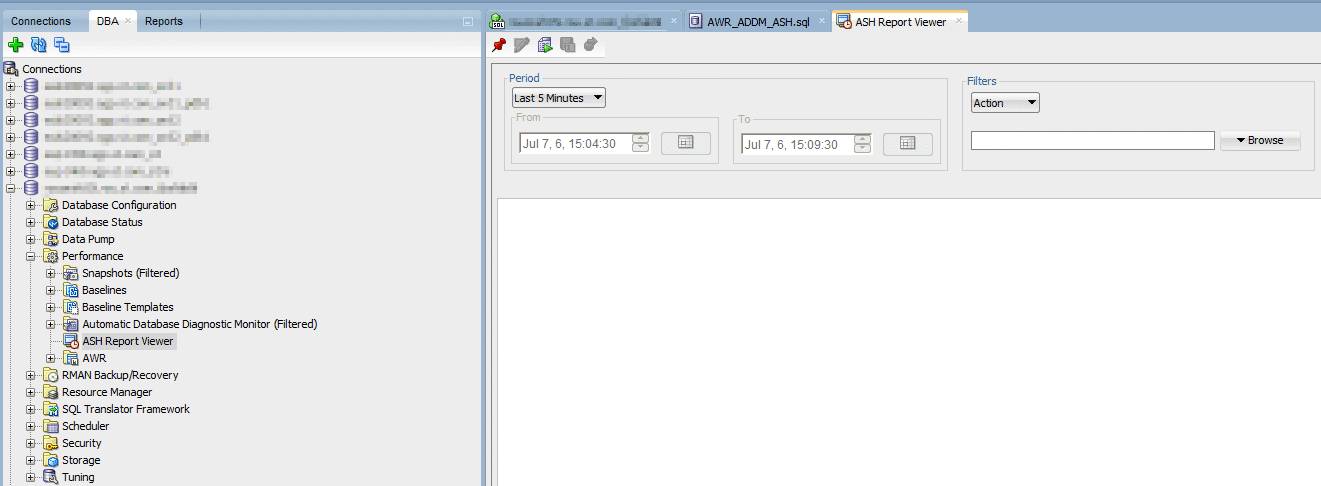
In the Java version of SQL Developer, in DBA tab there is an ASH Report Viewer that can also do the job with few mouse clicks:
ash_report_viewer01
Automatic Workload Repository (AWR)
In SQLcl there is a wrapper for AWR report (I have no doubt Oracle will add in future ADDM and ASH). Use “help awr” command to get more info, to even create a new snapshot:
SQL> awr list snapshots

   SNAP_ID          DBID BEGIN_INTERVAL_TIME            END_INTERVAL_TIME              FLUSH_LEVEL
__________ _____________ ______________________________ ______________________________ ______________
       780    1984200506 29/06/26 13:00:05,199000000    29/06/26 14:00:46,431000000    TYPICAL
       781    1984200506 29/06/26 14:00:46,431000000    29/06/26 15:00:28,962000000    TYPICAL
       782    1984200506 29/06/26 15:00:28,962000000    29/06/26 16:00:08,711000000    TYPICAL
.
.
.
SQL> awr create html 756 757
Report written to: awr_sid_2026-06-28-13.00.05_2026-06-28-14.00.28.html
Or use
DBMS_WORKLOAD_REPOSITORY.AWR_REPORT_HTML (DBMS_WORKLOAD_REPOSITORY.AWR_REPORT_TEXT for the text version). Use l_options to get the ADDM finings as well as the AWR report:
SQL> select
       *
     from dbms_workload_repository.awr_report_html(
       l_dbid     => (select dbid from v$database),
       l_inst_num => (select instance_number from v$instance),
       l_bid      => 755,
       l_eid      => 756,
       l_options  => 8
     );
.
.
.
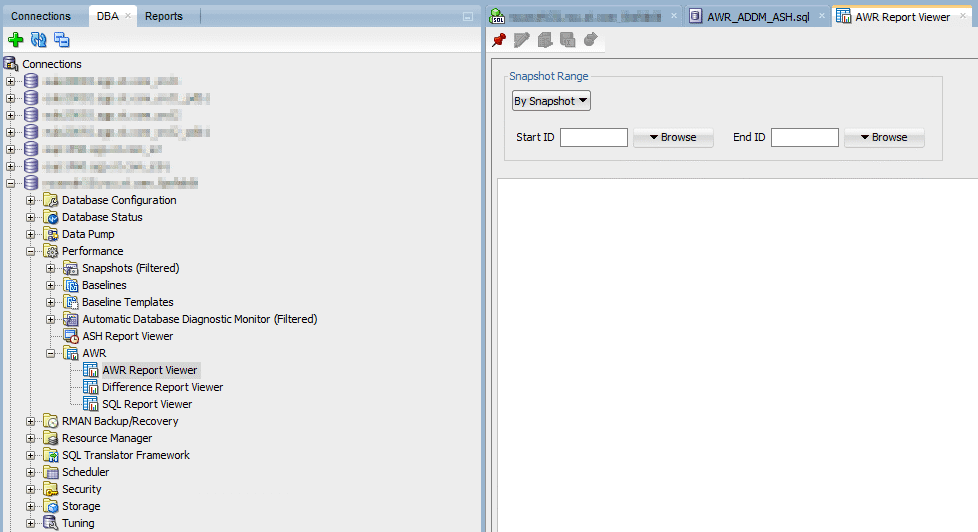
Same as for he other reports Java version of SQL Developer can do it graphically:
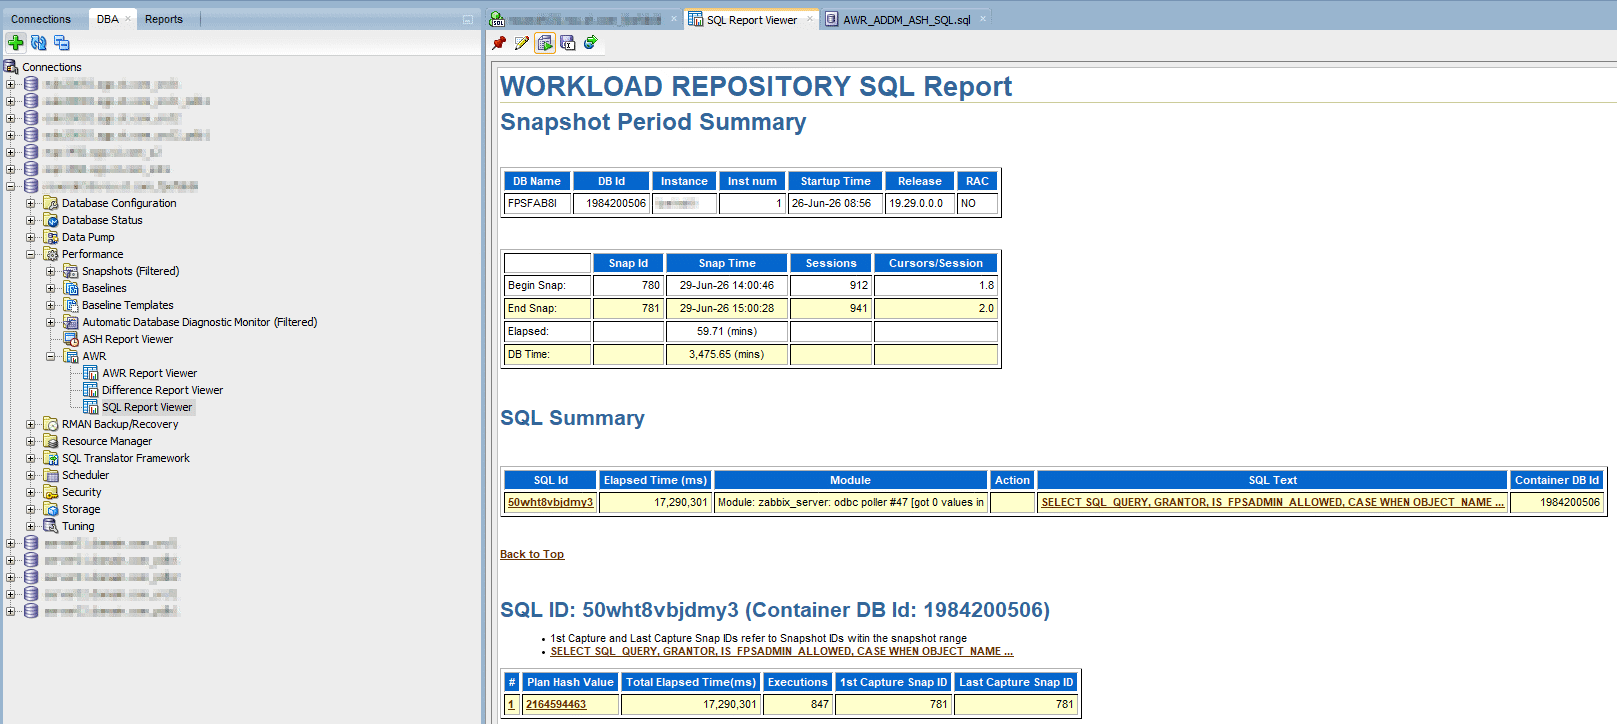
To focus on a sql_id that was appearing on top of my “Top SQL Statements” you can use SQL Developer Java version. First check that the sql_id appear on a snapshot range you plan to focus on (better use SQL Developer or restrict the number of columns):
select *
from dba_hist_active_sess_history
where snap_id=755
and sql_id='50wht8vbjdmy3'
order by sample_time desc;
The report is:
sql_report_viewer01
Or generate an AWR SQL report with DBMS_WORKLOAD_REPOSITORY.AWR_SQL_REPORT_HTML (or DBMS_WORKLOAD_REPOSITORY.AWR_SQL_REPORT_TEXT for the text version):
select *
from table(
  dbms_workload_repository.awr_sql_report_html(
    l_dbid      => (select dbid from v$database),
    l_inst_num  => (select instance_number from v$instance),
    l_bid       => 755,
    l_eid       => 756,
    l_sqlid     => '50wht8vbjdmy3'
  )
);
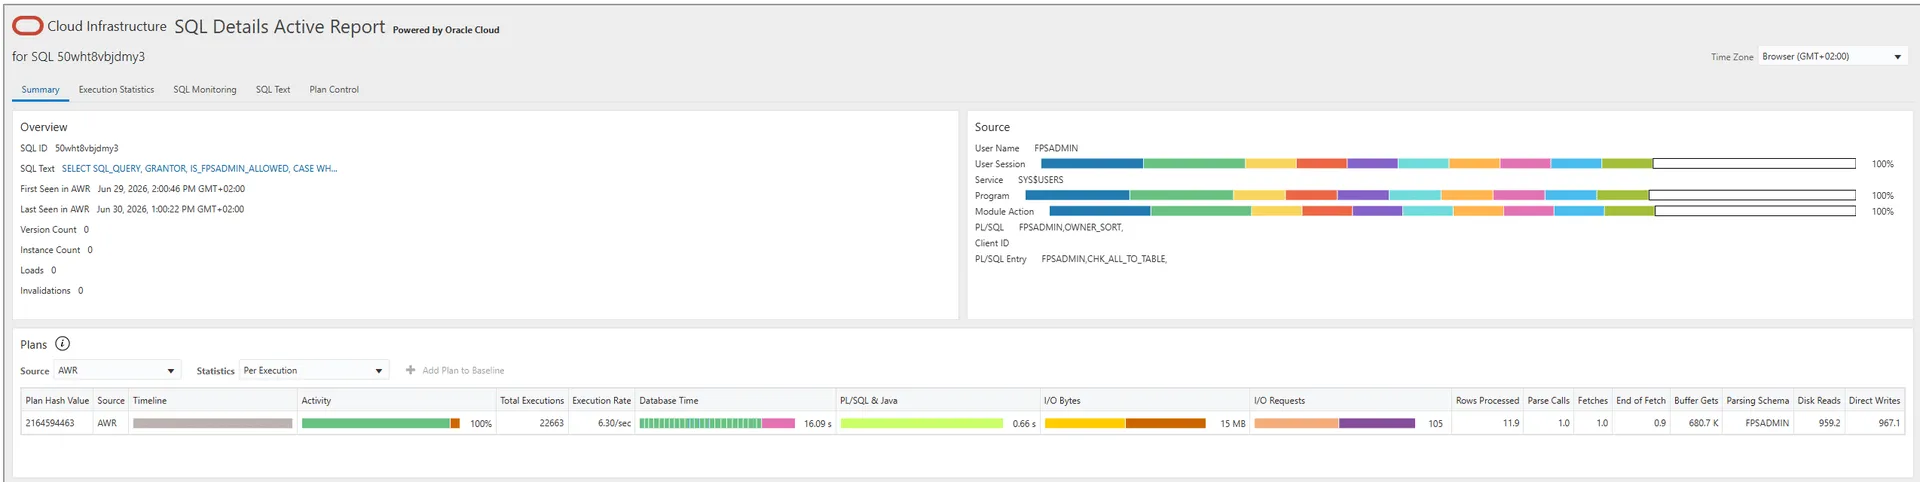
And if you have the Diagnostic paid Enterprise Edition pack, you can use DBMS_SQLTUNE.REPORT_SQL_DETAIL: