Table of contents
Preamble
As far as I remember one of our most important OLTP database, storing an home made application, has periodically suffered from performance problems. This database has been upgraded in 12cR1, moved to Linux RedHat 6 two years back as well as finally split from its applicative part (Tuxedo related). This has given us a lot of fresh air for a while but as time pass performance have degraded (why tune if hardware is under utilized) and the recent move of another application to the existing ones (made of tens of applications in reality) has moved us to a tense performance era…
Even if not explicitly mentioned in this blog, the performance of this database is one of the most challenging to maintain and this is also the one (along with our BI database) where I have seen the trickiest problem to solve (and so the source of many articles).
Recently one of my teammates has pushed to implement Oracle Disk Manager (ODM) from Veritas that I have tested back in 2012 but never ever implemented in live, refer to my previous document or official Veritas documentation on how to implement it.
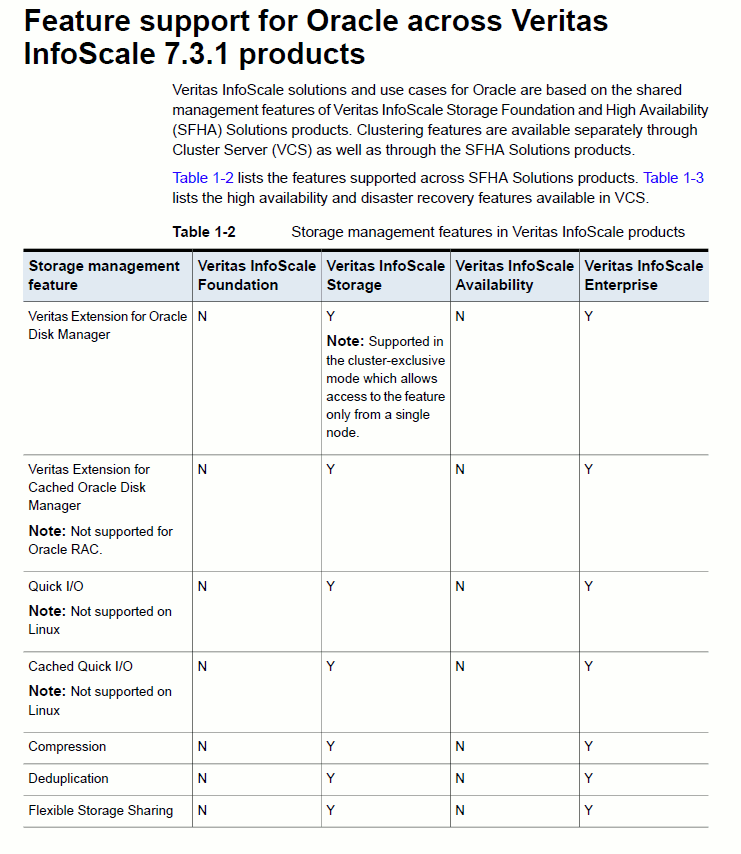
Please also note that this ODM feature must be purchased ad is included in Veritas InfoScale Storage and Veritas InfoScale Enterprise as displayed below:
To be really transparent in our actions during agreed downtime we have done:
- Implemented Oracle Disk Manager (ODM).
- Rebuilt blindly all application indexes.
- Corrected few logon storm issues. The worst case was one application doing 80,000 connections per day (yes almost one per second !!).
The change has been drastically beneficial and this is what we will se below…
The database is using Oracle Database 12c Enterprise Edition Release 12.1.0.2.0 – 64bit Production and is running on Red Hat Enterprise Linux Server release 6.5 (Santiago). The database size is around 2 TB. We are lucky enough to have licenses for Diagnostic and Tuning packs.
The below trial analysis is week before change versus week after change (working days).
Analysis
I have started to generate Operating System figures using HP OVPM, first chart I always generate is CPU figures. In below, break point is in the middle of the chart, this is a two weeks period:
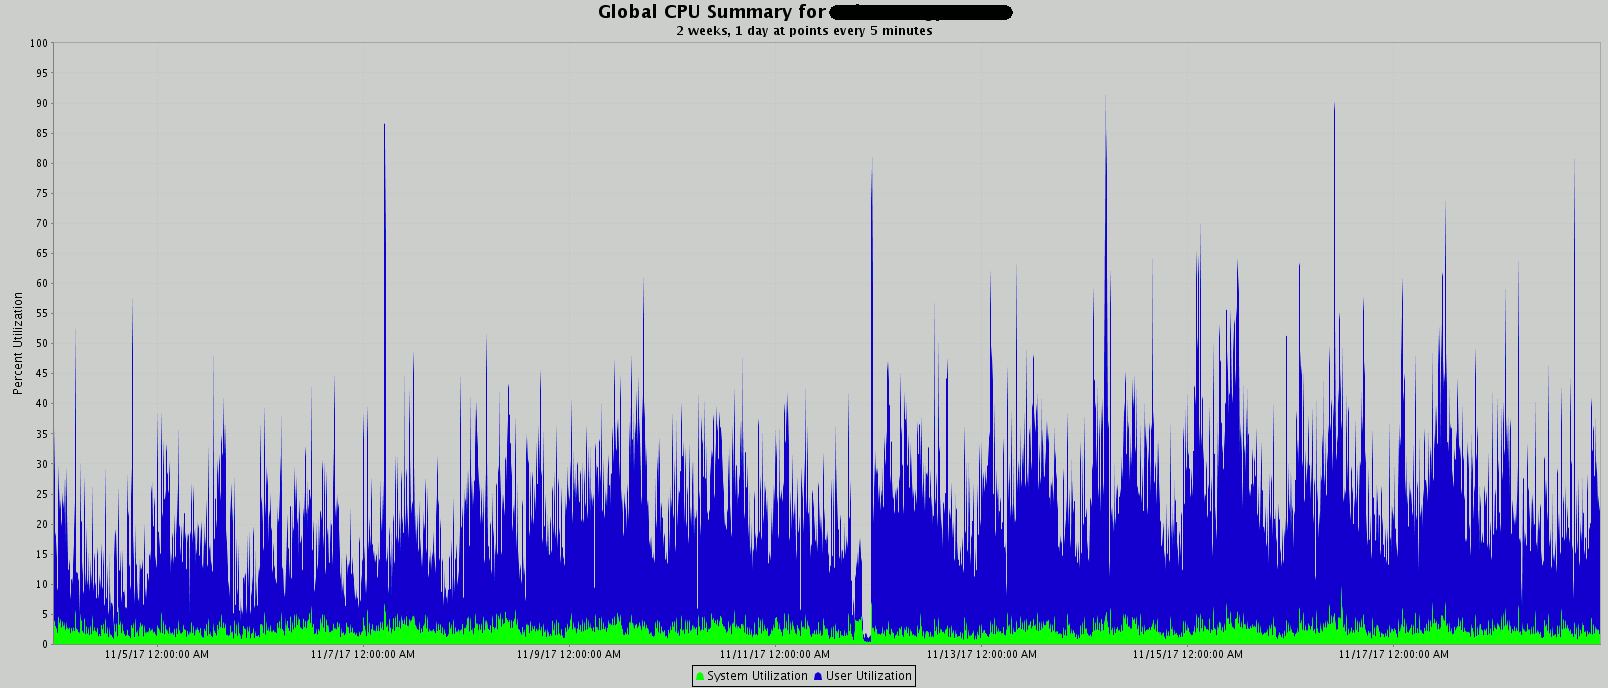
CPU usage has increased, we would not have positive users’ feedback about performance we would be puzzled… In fact CPU increase could be explained by I/O subsystem better performing and so database server is able to do much more work and serve more users, so the increase in CPU…
I have also generated disk related charts. In below the HP OVPM definition of metrics are:
GBL_DISK_PHYS_BYTE_RATE (Physical Disk Byte Rate):
The average number of KBs per second at which data was transferred to and from disks during the interval. The bytes for all types physical IOs are counted. Only local disks are counted in this measurement. NFS devices are excluded. This is a measure of the physical data transfer rate. It is not directly related to the number of IOs, since IO requests can be of differing lengths. This is an indicator of how much data is being transferred to and from disk devices. Large spikes in this metric can
indicate a disk bottleneck. On Unix systems, all types of physical disk IOs are counted, including file system, virtual memory, and raw reads.
GBL_DISK_PHYS_IO_RATE (Physical Disk Rate):
The number of physical IOs per second during the interval. Only local disks are counted in this measurement. NFS devices are excluded. On Unix systems, all types of physical disk IOs are counted, including file system IO, virtual memory IO and raw IO.
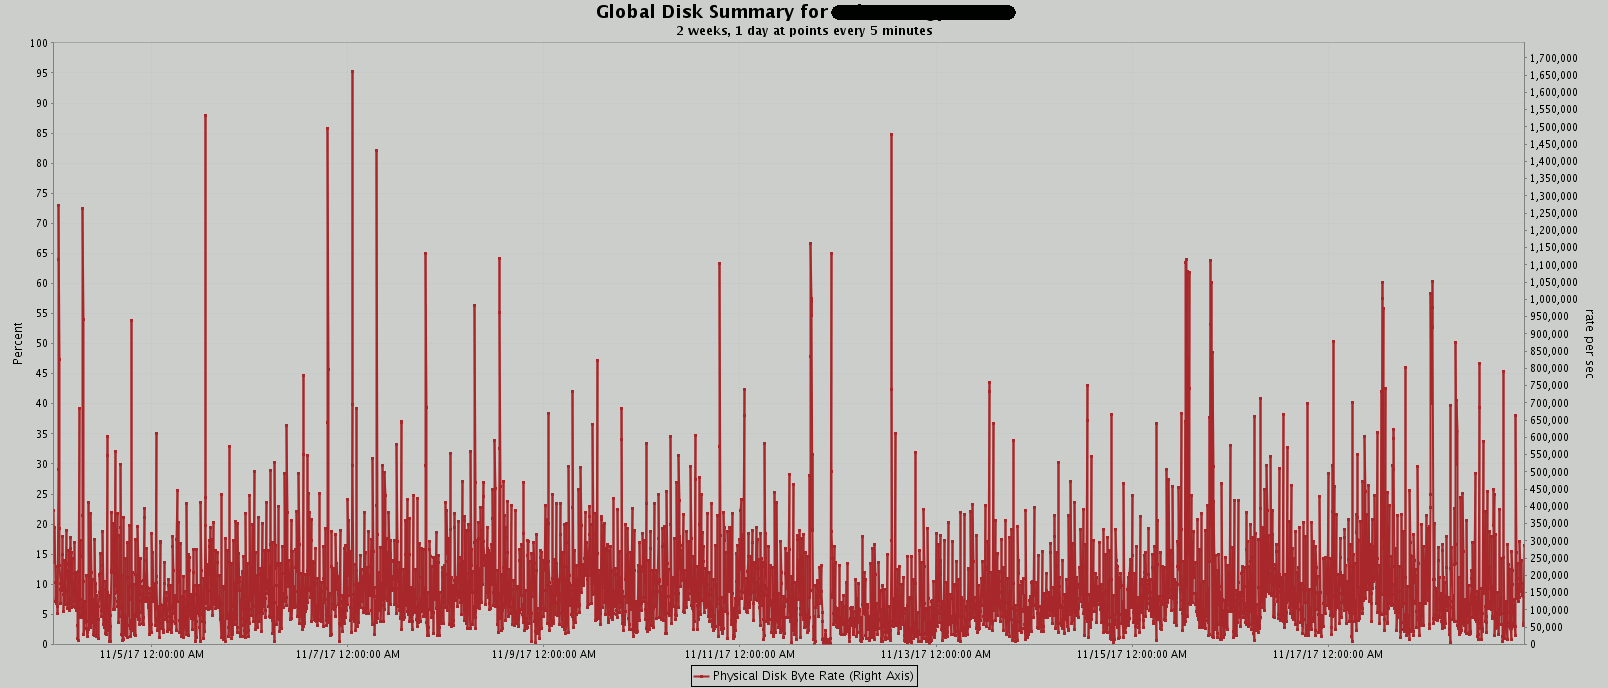
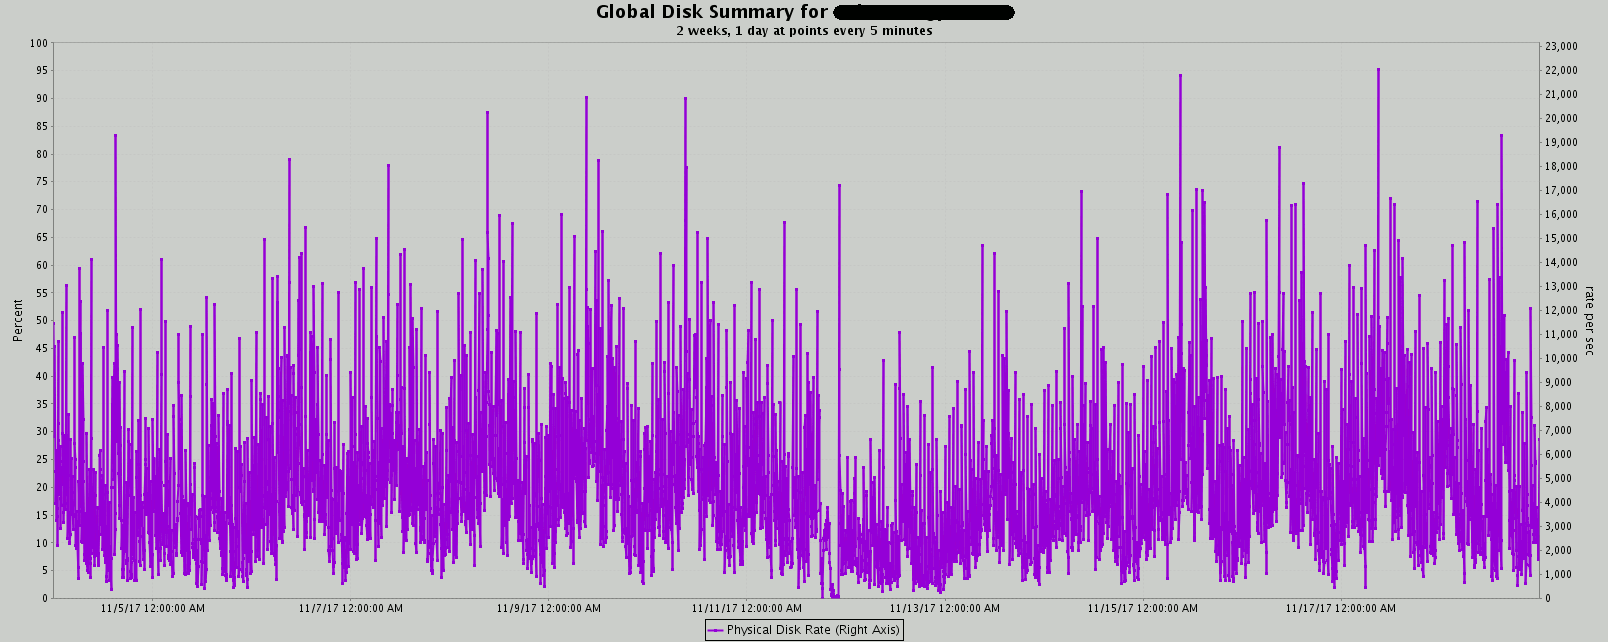
I am personally not able to see any change in trend related to IOPS…
Then I have generated an ADDM compare report. The procedure to use is DBMS_ADDM.COMPARE_DATABASES. You can can select the result of this procedure (for the base and compare periods) from dual and remove extra bad lines from the generated spool file that will become an HTML file. To display it I have been obliged to download an old release of Firefox portable (50.1.0) because the latest Chrome (62) and Firefox (57) releases I had on my desktop include additional security rules that forbid the display of the report.
So with huge difficulties I have been able to display it. The top part of the report is an average active session comparison.:
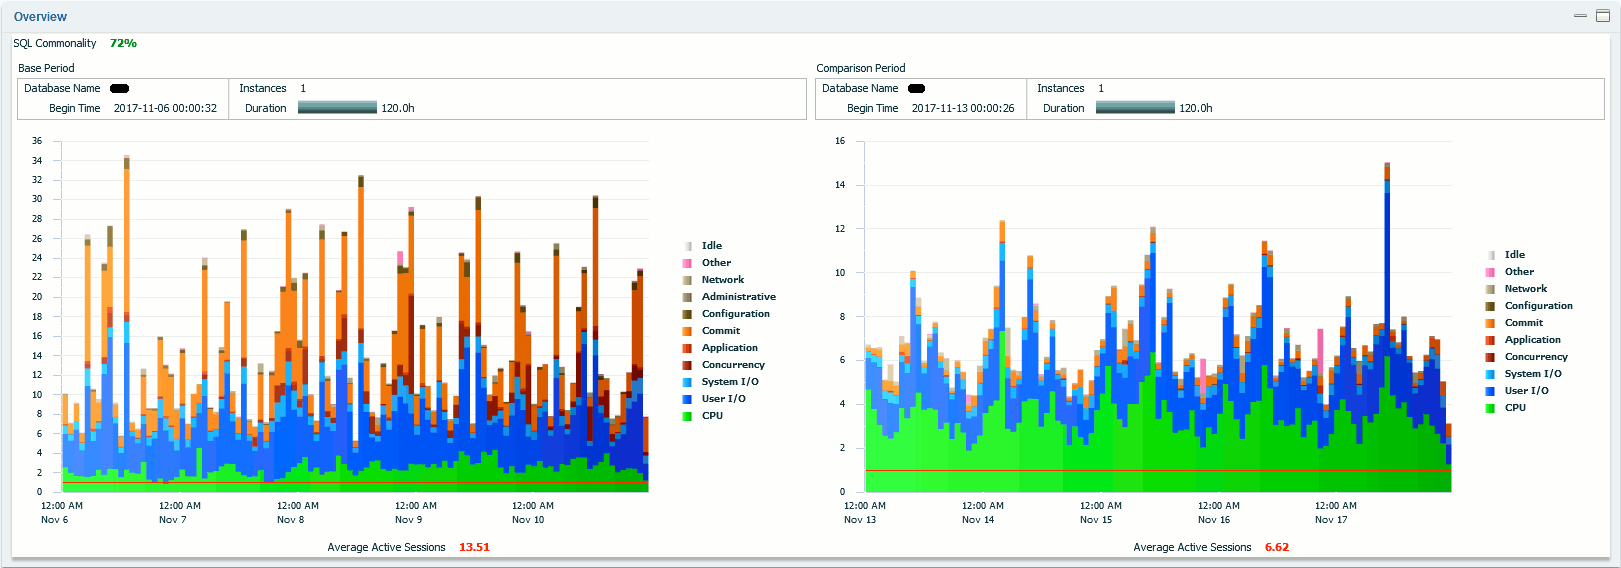
The graphical comparison in itself says it all. The Wait Classes Commit and Concurrency have almost disappeared and the Application wait class have greatly reduced. We also noticed average active sessions has been divided by two, we would explain it by the correction of the logon storm issues we had… We also confirm than additional CPU consumption has been done by Oracle sessions.
The bottom part (Resource tab) is an I/O comparison of the two periods, the other tabs have not shown any useful information:
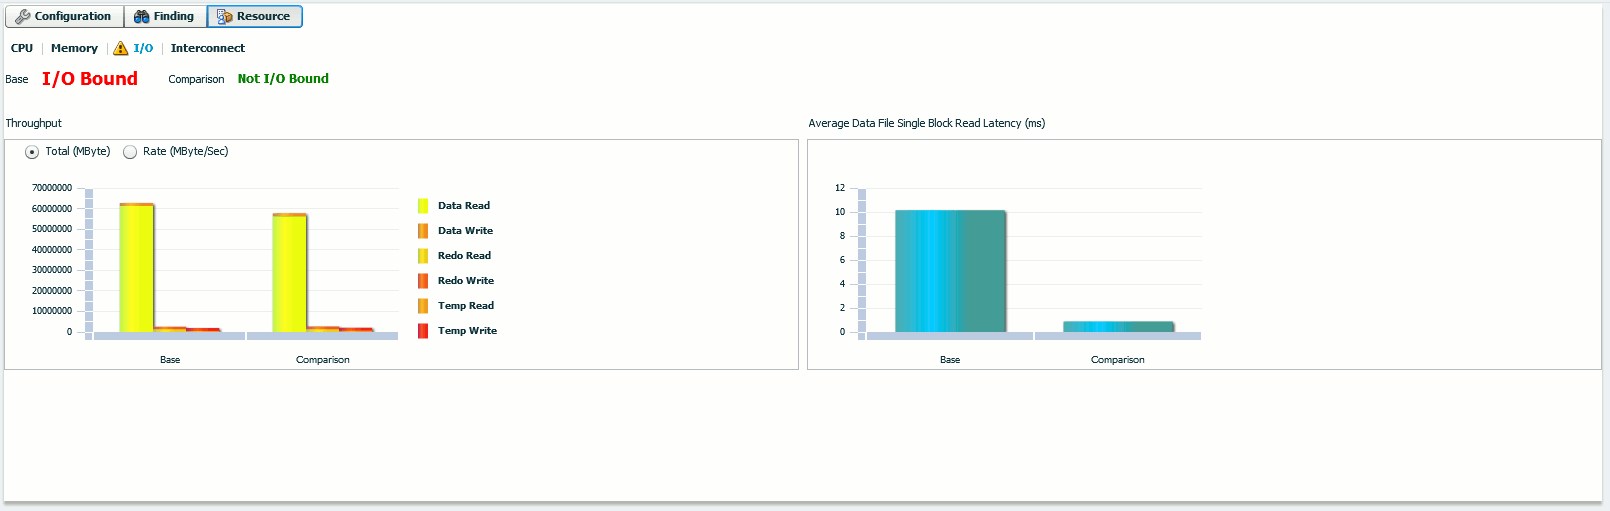
The Average Data File Single Block Read Latency (ms) has almost been divided by 10 with, obviously, no hardware change or upgrade.
I have also generated the classical AWR reports for each period (using awrrpt.sql script) as well as the much more interesting AWR compare period report (using awrddrpt.sql script).
The two standalone AWR reports in themselves do not bring more than the difference one. At least in the header of each I have the text confirmation of the above ADDM compare periods chart.
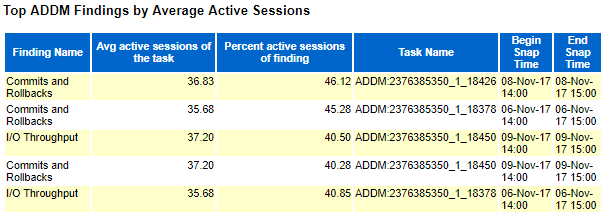
ADDM finding for first period (before ODM):
ADDM findings for second period (after ODM):
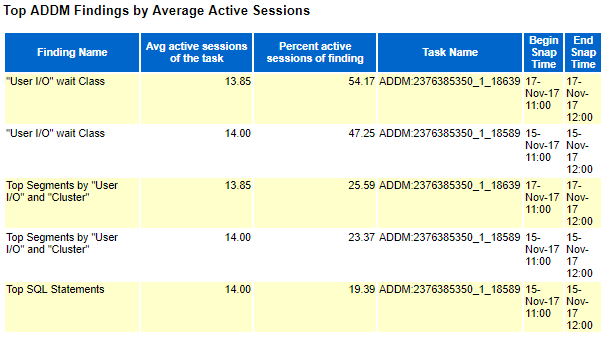
We obviously see a complete move from the “Commits and Rollbacks” wait class to the more classical “User I/O” wait class. I have been pushing development teams to reduce their commit frequency but in real life this is really complex to tune, even more when you are not able to finger point where to focus. Tuning “User I/O” wait class is far much easier as you can concentrate on SQL Statistics section of the report and tune the corresponding top SQL queries…
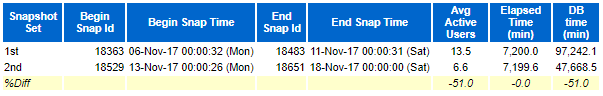
From the difference report the top header clearly show why our users are happier, the DB Time has been divided by two:
The difference load profile shows multiple interesting information:
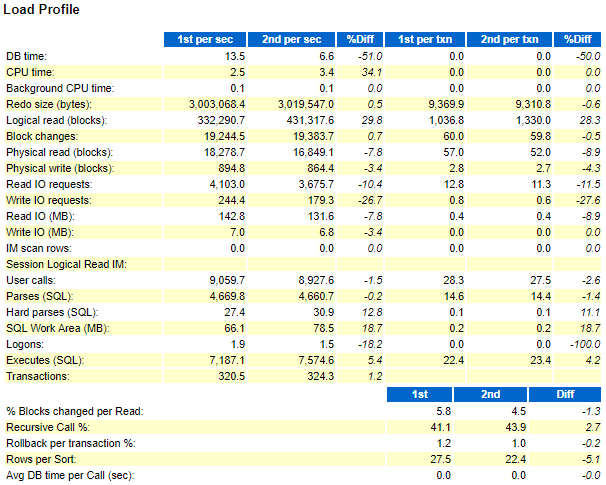
- The generated redo size is equivalent for the two period while we no more wait on it after ODM implementation.
- We have satisfied much more queries: CPU time and Logical read (blocks) increased. Again mainly linked to ODM.
- We have written and read less from disk: mainly due to indexes rebuild.
If we move on to the most interesting part, top timed events, we correlate the ADDM chart with text:
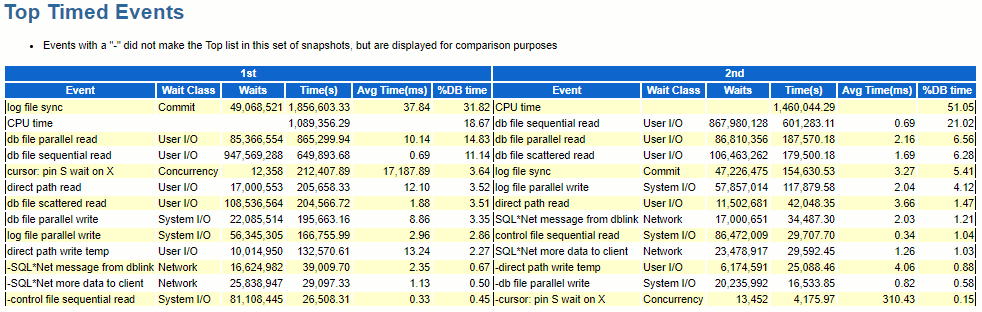
Various observations:
- We have almost same number of waits for log file sync (49 millions vs 47 millions) while the overall wait time has been divided by 12 (!!). Linked to the figures of equivalent redo size for the two periods we see the most interesting part of ODM implementation.
- Exact same comment for db file parallel read and direct path read: same number of waits around but overall wait time divided by 4-5 times.
- Strangely the other I/O related wait events do not show up a similar improvement…
- Cursor: pin S wait on X wait time has been divided by 50 but we did not change the application. I have not seen huge changes in SQL with high version count and/or in SQL having high parse call. So far it remains unexplained or indirectly linked to I/O improvement…
The last part I want to share is the tablespaces I/O stats, this part is directly linked to index rebuild and this clearly show the added value of having a good procedure to identify indexes that would benefit from rebuild:
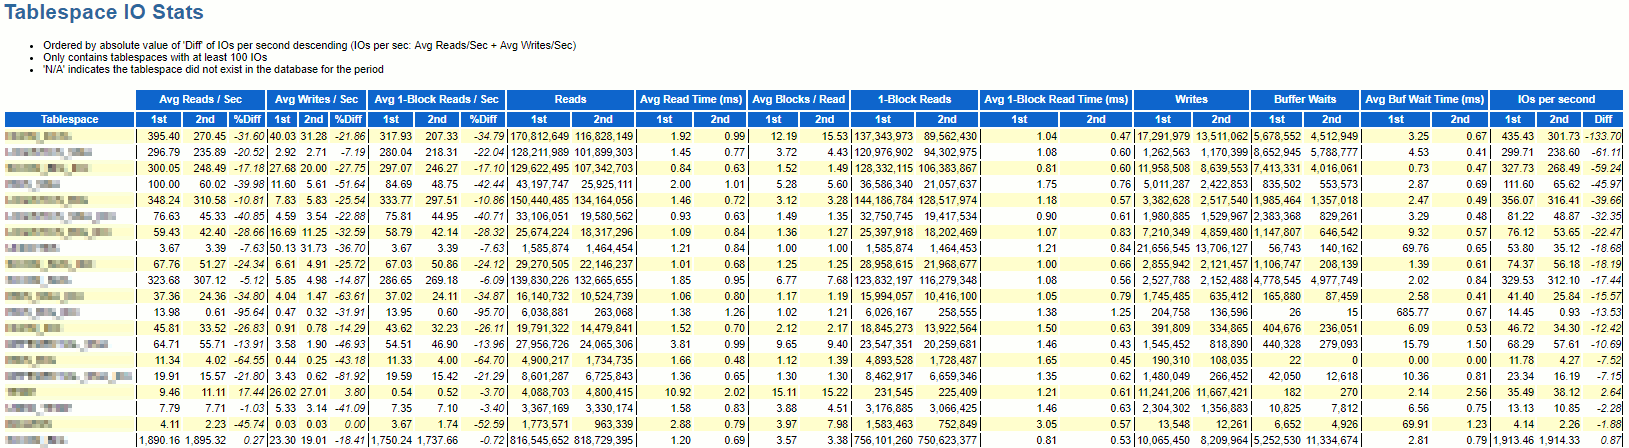
We not only improved IOPS but we have combined with a decreased in their number in practically all tablespaces of our applications…
Conclusion
Here we have seen that even if you use the world fastest full flash array or even if your database is fully stored on a Fusion I/O card using NVMe driver then if you still use VxFS filesystem the bottleneck might be elsewhere. And clearly it is worth to give a try to Oracle Disk Manager (ODM). Of course Automatic Storage Management (ASM) is still an option and should provide the same benefit but who would use it in a non-RAC environment ?
Also this is obviously not a bullet proof approach, meaning that if by design your application is performing really poorly (lots of bad queries performing millions of logical reads) then ODM will be of no help…
As next steps it would be interesting to investigate (non exhaustively):
- Cached Oracle Disk Manager (CODM): from Veritas document, ODM I/O normally bypasses the file system cache and directly reads from and writes to disk. Cached ODM enables some I/O to use caching and read ahead, which can improve ODM I/O performance for certain workloads.
- Have, or enhance an existing one, algorithm to identify indexes that would benefit from rebuild.
 tuning")


 installation and trouble shooting")

Douglas Snyder says:
Great article Yannick, thanks! I wrote a document on tuning InfoScale for maximum performance, if you are interested in it please let me know and I will be happy to send you a copy.
Yannick Jaquier says:
Thanks for comment Doug ! Yes please share it !
Brian Jansen says:
Hi Doug
Please forward me your document… It will be highly appreciated.
We have recently upgraded our 11.2.04 DB to 12.2.0.1 …
Thanks in advance.
Brian
brianj@discovery.co.za