Table of contents
Preamble
Since the feature what was formerly known as Advanced Analytics and now called Machine Learning, Spatial and Graph has been made freely available: explained here, here or here it was time for me to make a try of this highly hype Machine Learning feature. The Machine Learning part is accessible through the DBMS_DATA_MINING PL/SQL package. No doubt that with the number of free Machine Learning tools out there it was not sustainable for Oracle to make this option non free…
Needless to say that it was really hard for me to get an idea of what to do and even harder to reach even a small objective. We have all read lots and lots of articles on how machine learning is helping to analyze medical images for tumor research, fraud detection or even speech recognition. Here as we are in an Oracle database the source of information would be ideally structured (versus non-structure as for images) but again it was clearly not a piece of cake to organize my mind and find where to start.
Then I remembered a nice web site called Kaggle and I have tried to find on it a popular dataset with few tasks associated and ideally people who have kindly submitted and shared their work to be able to compare if I am able to reach a similar result. On Kaggle people mainly work with Python in what we call notebooks. The dataset I have chosen is the Water Quality (https://www.kaggle.com/adityakadiwal/water-potability) one. The associated task is:
Predict if water is safe for Human consumption:
Create a model to determine if the sample tested from the water body is fit for human consumption or not.
This dataset may require you to treat missing value if any and check for data imbalance.
My testing has been luckily done on a powerful bare metal test server made of 12 cores and 64GB of RAM running Red Hat Enterprise Linux Server release 7.8 (Maipo). My Oracle test database is a pluggable database (pdb1) running Oracle 19.12 (July 2021 Release Update).
Loading dataset
Download and transfer the csv file to your database server. When you transfer this dataset to your database server you might have to convert it with dos2unix tool to have strange hidden characters at the end of each line (you can spend a day on a stupid thing like this). Then put the file in any folder you like (the Unix account used to run the database must be able to read it) and load it as an external table with a code like below.
I start by creating an account for me and a directory and giving full privileges on this directory to my account:
SQL> CREATE USER yjaquier IDENTIFIED BY "secure_password"; USER created. SQL> GRANT dba TO yjaquier; GRANT succeeded. SQL> CREATE OR REPLACE DIRECTORY directory01 AS '/home/oracle/'; DIRECTORY created. SQL> GRANT read,WRITE ON DIRECTORY directory01 TO yjaquier; GRANT succeeded. |
Finally create the external table with:
SQL> CONNECT yjaquier/"secure_password"@pdb1 Connected. SQL> CREATE TABLE water_potability_csv ( ph NUMBER, hardness NUMBER, solids NUMBER, chloramines NUMBER, sulfate NUMBER, conductivity NUMBER, organic_carbon NUMBER, trihalomethanes NUMBER, turbidity NUMBER, potability NUMBER(1) ) ORGANIZATION external ( TYPE oracle_loader DEFAULT DIRECTORY directory01 ACCESS parameters ( records delimited BY newline skip 1 logfile 'water_potability.log' badfile 'water_potability.bad' discardfile 'water_potability.dsc' fields terminated BY ',' missing field VALUES are NULL ) location ('water_potability.csv') ) reject limit unlimited; TABLE created. |
You can control it has been well loaded by directly selecting the external table:
SQL> SET lines 200 SQL> SELECT COUNT(*) FROM water_potability_csv; COUNT(*) ---------- 3276 SQL> SELECT * FROM water_potability_csv FETCH FIRST 5 ROWS only; PH HARDNESS SOLIDS CHLORAMINES SULFATE CONDUCTIVITY ORGANIC_CARBON TRIHALOMETHANES TURBIDITY POTABILITY ---------- ---------- ---------- ----------- ---------- ------------ -------------- --------------- ---------- ---------- 204.890455 20791.319 7.30021187 368.516441 564.308654 10.3797831 86.9909705 2.96313538 0 3.71608008 129.422921 18630.0579 6.63524588 592.885359 15.1800131 56.3290763 4.50065627 0 8.09912419 224.236259 19909.5417 9.2758836 418.606213 16.8686369 66.4200925 3.05593375 0 8.31676588 214.373394 22018.4174 8.05933238 356.886136 363.266516 18.4365245 100.341674 4.62877054 0 9.09222346 181.101509 17978.9863 6.54659997 310.135738 398.410813 11.5582794 31.9979927 4.07507543 0 |
You can also control in the filesystem of the directory we created above that there is no water_potability.bad file and control in water_potability.log that everything goes well (confirmed by the number of loaded rows in my case).
For the case_id_column_name parameter of the dbms_data_mining.create_model procedure I have realized that I needed to add an sequence id kind of column on my dataset table:
SQL> CREATE TABLE water_potability ( id NUMBER GENERATED ALWAYS AS IDENTITY, ph NUMBER, hardness NUMBER, solids NUMBER, chloramines NUMBER, sulfate NUMBER, conductivity NUMBER, organic_carbon NUMBER, trihalomethanes NUMBER, turbidity NUMBER, potability NUMBER(1) ); SQL> INSERT INTO water_potability(ph, hardness, solids, chloramines, sulfate, conductivity, organic_carbon, trihalomethanes, turbidity, potability) SELECT * FROM water_potability_csv; 3276 ROWS created. SQL> COMMIT; COMMIT complete. |
Remark:
If you need more advanced transformation Oracle has implemented this in DBMS_DATA_MINING_TRANSFORM package.
Dataset queries and charts
The multiple answers of the Kaggle thread helps to see that we can almost get same repartition results in SQL (chartless in SQL obviously):
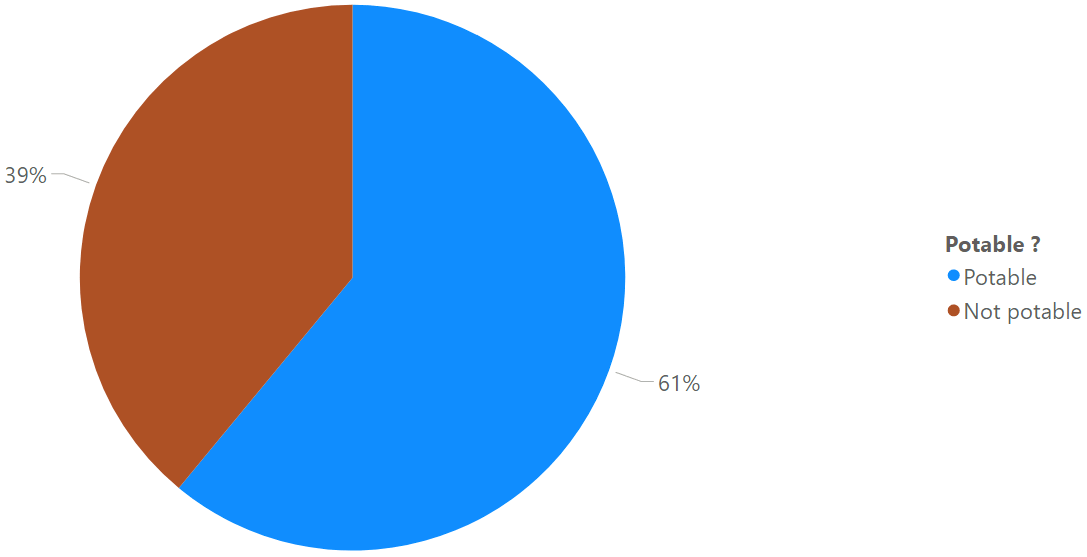
SQL> SELECT DECODE(potability,0,'Not potable','Potable') AS potability, ROUND(RATIO_TO_REPORT(COUNT(*)) over ()*100) AS percentage FROM water_potability GROUP BY potability; POTABILITY PERCENTAGE ----------- ---------- Potable 39 NOT potable 61 |
To display few charts you could do in Python (Matplotlib) with cx_Oracle connector or use free Power BI Desktop that I recently installed to test MariaDB ColumnStore (https://blog.yannickjaquier.com/mysql/mariadb-columnstore-installation-and-testing-part-1.html). I connected to my database using ODBC and EZConnect and imported in Power BI Desktop my water_potability table…
Potability samples repartition:
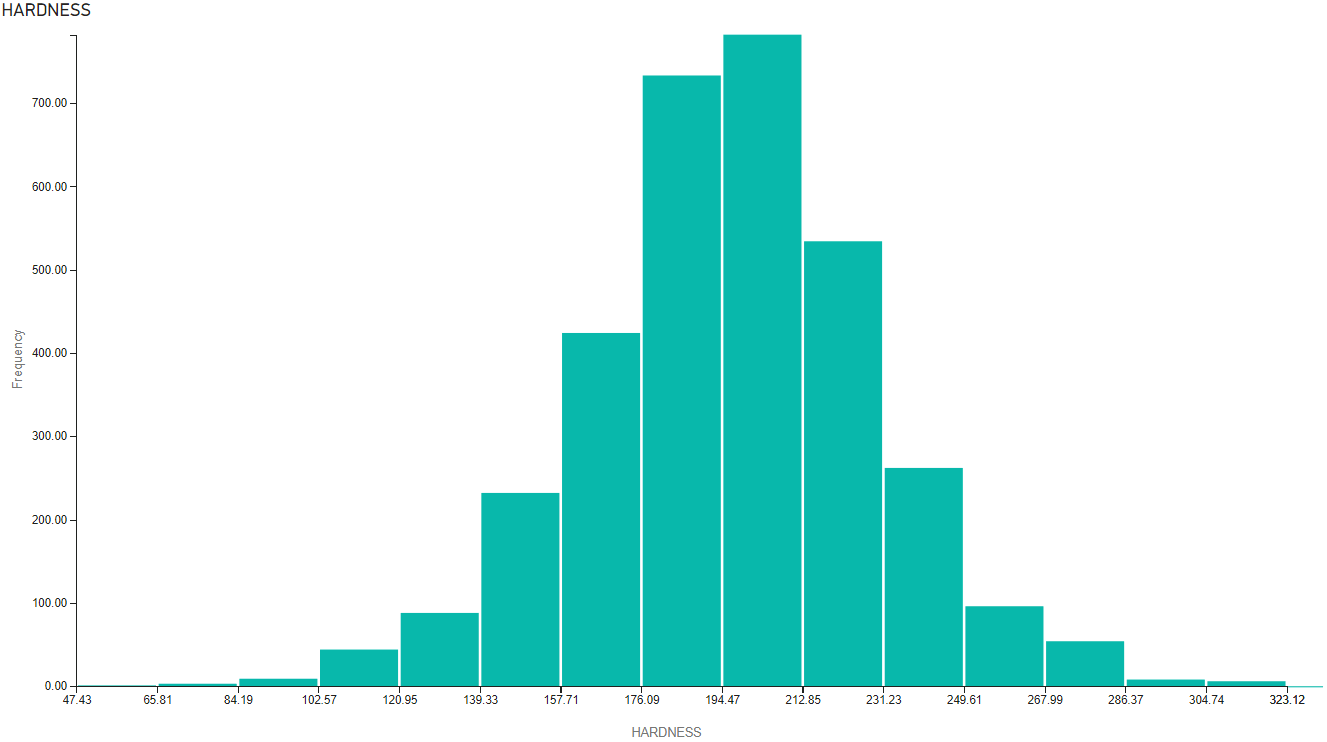
Hardness repartition:
The dataset has deliberately wrong figures and part of the task is to clean figures to replace the null values. One traditional approach is to replace those null values by median value which is not a complex task in Python with Pandas. I could also do this in SQL with queries like:
SQL> SELECT MEDIAN(ph) AS median_ph FROM water_potability WHERE potability=0 AND ph IS NOT NULL; MEDIAN_PH ---------- 7.03545552 |
But Oracle in their DBMS_DATA_MINING package has their own automatic data cleaning algorithms that I’m planning to activate so skipping this task for now…
Model creation and testing
You need an option table as described in official documentation:
SQL> CREATE TABLE model_settings(setting_name VARCHAR2(30), setting_value VARCHAR2(30)); TABLE created. |
One typical activity is to split the dataset in training sample and testing sample, not to train your data model on the testing sample. One rule of thumb is to split in 80%/20% and do the training on the 80% and test the accuracy of your model on the remaining 20%:
SQL> CREATE TABLE water_potability_training AS SELECT * FROM water_potability SAMPLE (80); TABLE created. SQL> CREATE TABLE water_potability_testing AS SELECT * FROM water_potability MINUS SELECT * FROM water_potability_training; TABLE created. SQL> SELECT COUNT(*) FROM water_potability_training; COUNT(*) ---------- 2619 SQL> SELECT COUNT(*) FROM water_potability_testing; COUNT(*) ---------- 657 SQL> SELECT COUNT(*) FROM water_potability; COUNT(*) ---------- 3276 |
When playing with different models and their associated parameters if you are too optimistic then you can end up with a very long running time for the CREATE_MODEL procedure. This running time was also serial (using one thread) so if you wish to use more power of your database server (see conclusion for the pros and cons) I have also changed the attributes of my table to allow parallel operation and put in in memory with:
SQL> ALTER TABLE water_potability_training parallel inmemory; TABLE altered. |
Remark:
I recall that InMemory paid Enterprise option is free if you use less than 16GB. To be sure you are compliant you can even set the limit to 16GB with inmemory_size parameter.
Choose your model and set its parameters. Be very careful all the insertion must be in a PL/SQL block or you will get error message like (ORA-06553: PLS-221: ‘ALGO_NAME’ is not a procedure or is undefined). I have chosen the Random Forest algorithm as this is the one that provided better result from people who submitted a task answer on Kaggle (it would have been difficult alone to decide which one to choose). When using Random Forest algorithm you can also tweak the Decision Tree algorithm parameters:
SQL> BEGIN -- Clean the table before starting (TRUNCATE cannot be used in PL/SQL) DELETE FROM model_settings; -- Choose your model INSERT INTO model_settings VALUES(dbms_data_mining.algo_name, dbms_data_mining.algo_random_forest); -- Automatic data preparation activation INSERT INTO model_settings VALUES(dbms_data_mining.prep_auto, dbms_data_mining.prep_auto_on); -- Missing value will be replaced by mean value INSERT INTO model_settings VALUES (dbms_data_mining.odms_missing_value_treatment, dbms_data_mining.odms_missing_value_mean_mode); -- Algorithm Settings: Random Forest INSERT INTO model_settings VALUES (dbms_data_mining.rfor_mtry, 0); INSERT INTO model_settings VALUES (dbms_data_mining.rfor_num_trees, 100); INSERT INTO model_settings VALUES (dbms_data_mining.rfor_sampling_ratio, 1); INSERT INTO model_settings VALUES (dbms_data_mining.tree_term_max_depth, 50); COMMIT; END; / PL/SQL PROCEDURE successfully completed. SQL> SELECT * FROM model_settings; SETTING_NAME SETTING_VALUE ------------------------------ ------------------------------ ALGO_NAME ALGO_RANDOM_FOREST PREP_AUTO ON ODMS_MISSING_VALUE_TREATMENT ODMS_MISSING_VALUE_MEAN_MODE RFOR_MTRY 0 RFOR_NUM_TREES 100 RFOR_SAMPLING_RATIO 1 6 ROWS selected. |
Finally create the model, it will also training it so the execution time is linked to chosen algorithm and its parameters:
-- create the model using the specified settings BEGIN dbms_data_mining.create_model( model_name => 'water_potability_model', mining_function => dbms_data_mining.classification, data_table_name => 'water_potability_training', case_id_column_name => 'id', target_column_name => 'potability', settings_table_name => 'model_settings'); END; / PL/SQL PROCEDURE successfully completed. |
If you plan to make multiple test by playing with model parameters you must drop the model first before creating a new one:
SQL> EXEC dbms_data_mining.drop_model('water_potability_model'); PL/SQL PROCEDURE successfully completed. |
Remark:
The procedure is also creating plenty of DM$xxWATER_POTABILITY_MODEL tables.
I have finally used below query to apply my model on the 20% sample of testing data. The best accuracy I have been able to get is 65% with the Random Forest algorithm:
SQL> SELECT predicted, ROUND(RATIO_TO_REPORT(COUNT(*)) over ()*100) AS percentage FROM ( SELECT CASE WHEN potability=predicted_potability THEN 'Good' ELSE 'Bad' END AS predicted FROM ( SELECT t.*, PREDICTION (water_potability_model USING *) predicted_potability FROM water_potability_testing t) ) GROUP BY predicted; PRED PERCENTAGE ---- ---------- Good 65 Bad 35 |
This is here one huge difficulty I have found (at least for me) is which algorithm to choose ? You might not have time and/or energy/resource to test them all. Then when you have chosen your algorithm when you paly with its parameters (Random Forest algorithm for me) I have also experimented that better is enemy of good enough as each time I have tried to add more trees or fraction of the training data to be randomly sampled it has given a worse result…More or less each time it has ended up with a worst accuracy but with a drastic increase in CPU consumption.
Last but not least, I was honestly expecting an higher accuracy as people on Kaggle are going up to 80%. Maybe I doing something wrong or my whole exercise is wrong. Do not hesitate to comment if you see something stupid in my logic…
Conclusion
I don’t really know what to think with this Oracle database Machine Learning feature. In one hand Oracle has made something easy to use and you obviously use it with a language you already know very well: SQL. Of course the Machine Learning language is Python so if you are in this domain Python is most probably your best friend.
On the other hand you do machine learning at the cost of the Oracle database while doing Python and cx_Oracle is almost *free* (separate server, even a virtual machine, with all free components).
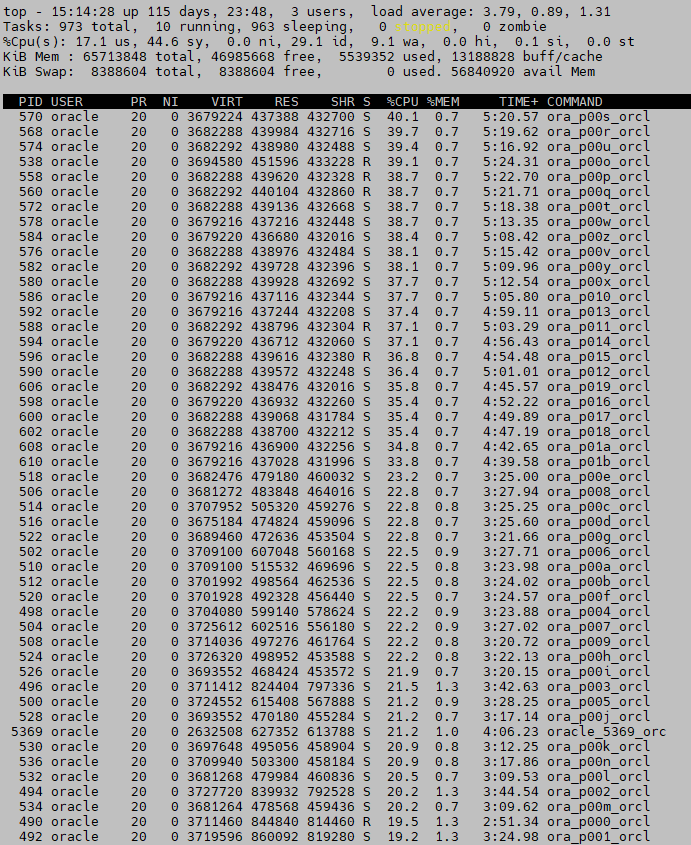
I have taken a screenshot of my server while creating a model and it can be like this for more than 10 minutes from my simple trial dataset (if you keep the default algorithm parameters you will not have this situation):
Then of course the feature has become free and, for me, it is clearly a must if Oracle expect people to use it as the free offer is really generous (Scikit-learn, tensorflow, Spark ML, …). Before deciding to use it you have to balance the additional CPU consumption you will make on your database server versus having a dedicated server with Python and offloading your figures to it… I would say that if your dataset is huge and computing a model is fast then this option is interesting. You can also live see the result of your model applied to your figures with a simple SQL statement…
DBMS_PREDICTIVE_ANALYTICS all in one bonus package
I have also tried with DBMS_PREDICTIVE_ANALYTICS package that is more easy to implement for noob on Machine Learning like me. if you have already use the DBMS_DATA_MINING package then this one is much simpler to implement but you have obviously less control over it.
I start with the EXPLAIN procedure that I initially did not even consider but at the end it provides interesting information on which columns Oracle will use to make a prediction of your target column. To not have the required added ID column you could also issue it on the WATER_POTABILITY_CSV external table if you like:
SQL> EXEC dbms_predictive_analytics.EXPLAIN(data_table_name => 'water_potability_training', explain_column_name => 'potability', result_table_name => 'water_potability_explain'); PL/SQL PROCEDURE successfully completed. SQL> SET lines 200 SQL> col attribute_name FOR a15 SQL> col attribute_subname FOR a15 SQL> SELECT * FROM water_potability_explain; ATTRIBUTE_NAME ATTRIBUTE_SUBNA EXPLANATORY_VALUE RANK --------------- --------------- ----------------- ---------- ID .552324937 1 SULFATE .007351846 2 PH 0 3 TRIHALOMETHANES 0 3 TURBIDITY 0 3 CONDUCTIVITY 0 3 CHLORAMINES 0 3 ORGANIC_CARBON 0 3 HARDNESS 0 3 SOLIDS 0 3 10 ROWS selected. |
It’s a bit disturbing, and if I understand it well, but apparently only SULFATE column is taken into account to make a prediction. This might explain the poor result I’ll get…
Then I start with a similar execution as with DBMS_DATA_MINING package. Here no model to choose and I would even not need to split my table in training and testing data sets:
SQL> SET serveroutput ON SIZE 999999 SQL> DECLARE v_accuracy NUMBER(10,9); BEGIN DBMS_PREDICTIVE_ANALYTICS.PREDICT( accuracy => v_accuracy, data_table_name => 'water_potability_training', case_id_column_name => 'id', target_column_name => 'potability', result_table_name => 'water_potability_predict_result'); DBMS_OUTPUT.PUT_LINE('Accuracy = ' || v_accuracy); END; / Accuracy = .055282742 PL/SQL PROCEDURE successfully completed. |
Remark:
The returned accuracy is clearly not good…
To check the predicted value versus the real one:
SQL> col probability FOR 9.999999999 SQL> SELECT a.potability, b.PREDICTION,b.probability FROM water_potability a, water_potability_predict_result b WHERE a.id=b.id FETCH FIRST 10 ROWS only; POTABILITY PREDICTION PROBABILITY ---------- ---------- ------------ 0 0 .610151794 0 0 .610151734 0 1 .389848346 0 1 .389848362 0 1 .389848299 0 1 .389848292 0 1 .389848368 0 1 .389848334 0 1 .389848339 0 0 .610151736 10 ROWS selected. |
Finally same query as DBMS_DATA_MINING package to see that result is not really good:
SQL> SELECT predicted, ROUND(RATIO_TO_REPORT(COUNT(*)) over ()*100) AS percentage FROM ( SELECT CASE WHEN potability=PREDICTION THEN 'Good' ELSE 'Bad' END AS predicted FROM ( SELECT a.potability, b.PREDICTION FROM water_potability_training a, water_potability_predict_result b WHERE a.id = b.id) ) GROUP BY predicted; PRED PERCENTAGE ---- ---------- Good 52 Bad 48 |
If I query eliminating where the probability is not good the accuracy improve and we almost reach previous result but we eliminated few predictions:
SQL> SELECT predicted, ROUND(RATIO_TO_REPORT(COUNT(*)) over ()*100) AS percentage FROM ( SELECT CASE WHEN potability=PREDICTION THEN 'Good' ELSE 'Bad' END AS predicted FROM ( SELECT a.potability, b.PREDICTION FROM water_potability_training a, water_potability_predict_result b WHERE a.id = b.id AND probability > 0.5) ) GROUP BY predicted; PRED PERCENTAGE ---- ---------- Bad 36 Good 64 |
References
- Creating a Prediction Model in Oracle Database!
- Water Quality – Drinking water potability
- Programmatic interfaces to Oracle Machine Learning for SQL (OML4SQL)
- Oracle Machine Learning


 installation and usage")

 hands-on")