Table of contents
Preamble
One of my customer bring to my attention a SELECT on an Index Organized Table (IOT) that was not performing well. As usual I generated the SQL trace and executed the query to generate the autotrace and the associated statistics (SET AUTOTRACE TRACEONLY EXPLAIN STATISTICS). Started with a tkprof on the trace file and saw quite a lot of SQL*Net message from client, SQL*Net message to client and SQL*Net more data to client, just to say that I’m not particularly familiar with this as normally I do a SELECT count(*) instead of selecting the columns of the original query (this could also bring some change in the explain plan but this is another story). The autotrace output was also showing huge figures for bytes sent via SQL*Net to client, bytes received via SQL*Net from client and SQL*Net roundtrips to/from client.
So, as usual, started by Google search on SQL*Net roundtrips to/from client and SQL*Net message to client and obviously found many interesting blog references (particularly the ones of Hemant and Tanel Poder). So forgot the query of my customer and started from scratch on a basic one thinking it was not possible to have pass by on this for so long… I was wrong…
SQL*Plus parameter of interest is ARRAYSIZE: Sets the number of rows that SQL*Plus will fetch from the database at one time. Valid values are 1 to 5000.
Testing
Testing done with SQL*Plus Windows release using below:
SQL> SET autotrace traceonly STATISTICS SQL> SET TIMING ON |
Note down the default value for every SQL*Plus session you initiate:
SQL> show arraysize linesize pagesize arraysize 15 linesize 80 pagesize 14 |
For this example I’m selecting on DBA_SOURCE table.
ARRAYSIZE = 15
SQL> SET arraysize 15 SQL> ALTER SESSION SET events '10046 trace name context forever, level 12'; SQL> SELECT * FROM dba_source; 624084 ROWS selected. Elapsed: 00:01:13.65 STATISTICS ---------------------------------------------------------- 24531 recursive calls 0 db block gets 74408 consistent gets 8354 physical reads 0 redo SIZE 49392703 bytes sent via SQL*Net TO client 458046 bytes received via SQL*Net FROM client 41607 SQL*Net roundtrips TO/FROM client 15 sorts (memory) 0 sorts (disk) 624084 ROWS processed SQL> ALTER SESSION SET events '10046 trace name context off'; |
TKPROF of the associated trace file:
call count cpu elapsed disk query current rows ------- ------ -------- ---------- ---------- ---------- ---------- ---------- Parse 1 0.08 0.10 0 0 0 0 Execute 1 0.00 0.00 0 0 0 0 Fetch 41607 5.72 5.94 8128 50069 0 624084 ------- ------ -------- ---------- ---------- ---------- ---------- ---------- total 41609 5.80 6.04 8128 50069 0 624084 Elapsed times include waiting on following events: Event waited on Times Max. Wait Total Waited ---------------------------------------- Waited ---------- ------------ ges message buffer allocation 11 0.00 0.00 library cache lock 2 0.00 0.00 library cache pin 2 0.00 0.00 KJC: Wait for msg sends to complete 3 0.00 0.00 SQL*Net message to client 41607 0.00 0.07 asynch descriptor resize 4 0.00 0.00 reliable message 1 0.00 0.00 enq: KO - fast object checkpoint 2 0.00 0.00 kfk: async disk IO 139 0.00 0.00 direct path read 2 0.01 0.01 SQL*Net message from client 41607 0.04 63.11 SQL*Net more data to client 7677 0.00 0.07 |
As we can see over the 73.65 seconds of the query duration 63.11 seconds are spent doing SQL*Net message from client…
ARRAYSIZE = 200
Second test using a bigger value for ARRAYSIZE:
SQL> SET arraysize 200 SQL> ALTER SESSION SET events '10046 trace name context forever, level 12'; SQL> SELECT * FROM dba_source; 624084 ROWS selected. Elapsed: 00:00:14.76 STATISTICS ---------------------------------------------------------- 24091 recursive calls 0 db block gets 36316 consistent gets 8128 physical reads 0 redo SIZE 46082993 bytes sent via SQL*Net TO client 34711 bytes received via SQL*Net FROM client 3122 SQL*Net roundtrips TO/FROM client 2 sorts (memory) 0 sorts (disk) 624084 ROWS processed SQL> ALTER SESSION SET events '10046 trace name context off'; |
TKPROF of the associated trace file:
call count cpu elapsed disk query current rows ------- ------ -------- ---------- ---------- ---------- ---------- ---------- Parse 1 0.08 0.08 0 6 0 0 Execute 1 0.00 0.00 0 0 0 0 Fetch 3122 4.80 5.32 8128 12062 0 624084 ------- ------ -------- ---------- ---------- ---------- ---------- ---------- total 3124 4.88 5.40 8128 12068 0 624084 Elapsed times include waiting on following events: Event waited on Times Max. Wait Total Waited ---------------------------------------- Waited ---------- ------------ ges message buffer allocation 11 0.00 0.00 library cache lock 2 0.00 0.00 library cache pin 2 0.00 0.00 KJC: Wait for msg sends to complete 4 0.00 0.00 SQL*Net message to client 3122 0.00 0.00 asynch descriptor resize 4 0.00 0.00 reliable message 1 0.00 0.00 enq: KO - fast object checkpoint 2 0.00 0.00 kfk: async disk IO 137 0.00 0.00 direct path read 25 0.06 0.33 SQL*Net message from client 3122 0.03 8.92 SQL*Net more data to client 21455 0.01 0.35 |
Much more better, query is now executed in 14.76 seconds (!!) and 7 times less wait on SQL*Net message from client. We also noticed that the number of consistent gets, bytes sent via SQL*Net to client, bytes received via SQL*Net from client and SQL*Net roundtrips to/from client have decreased.
Summary and conclusion
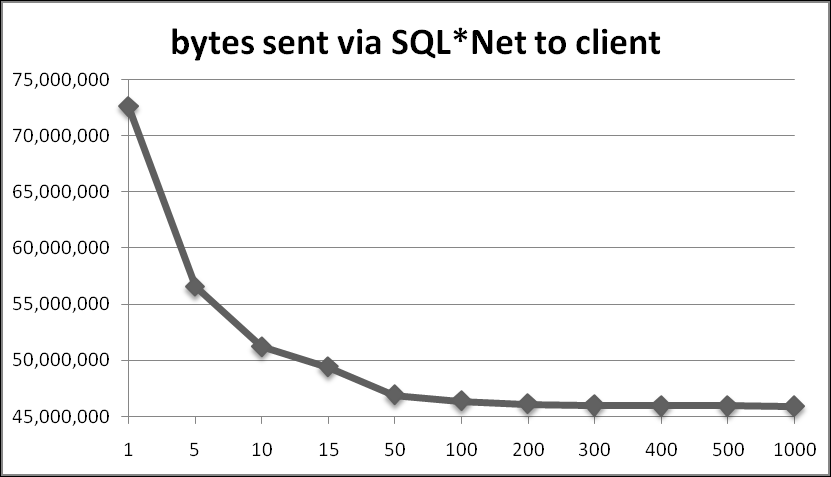
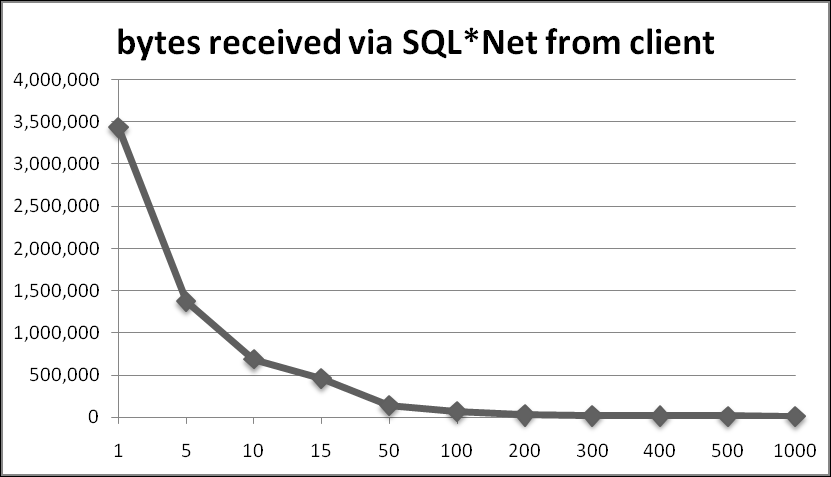
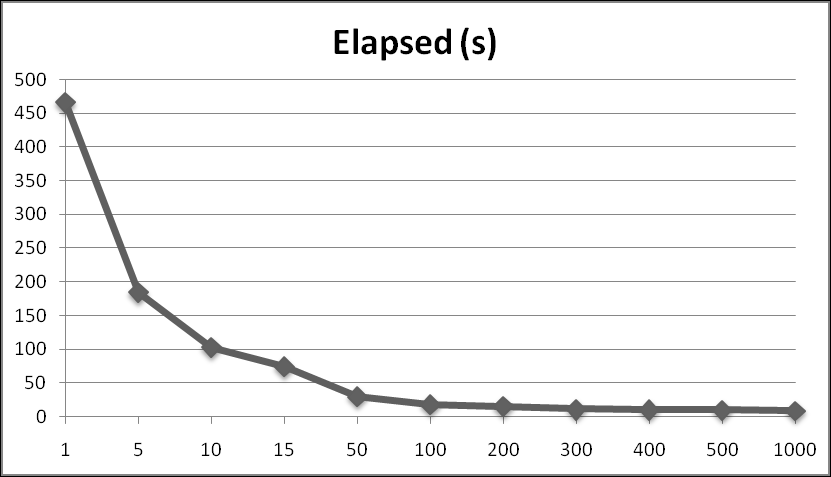
Results of different value for ARRAYSIZE aggregated in below table:
| arraysize | consistent gets | bytes sent via SQL*Net to client | bytes received via SQL*Net from client | SQL*Net roundtrips to/from client | Elapsed (s) |
|---|---|---|---|---|---|
| 1 | 341495 | 72650199 | 3432842 | 312043 | 465.98 |
| 5 | 156439 | 56548849 | 1373367 | 124818 | 183.87 |
| 10 | 94820 | 51181761 | 686879 | 62410 | 102.50 |
| 15 | 74408 | 49392703 | 458046 | 41607 | 73.65 |
| 50 | 45548 | 46888039 | 137682 | 12483 | 29.40 |
| 100 | 39398 | 46351313 | 69031 | 6242 | 17.59 |
| 200 | 36316 | 46082993 | 34711 | 3122 | 14.76 |
| 300 | 35296 | 45993553 | 23271 | 2082 | 11.00 |
| 400 | 34778 | 45948833 | 17551 | 1562 | 10.23 |
| 500 | 34472 | 45922001 | 14119 | 1250 | 9.64 |
| 1000 | 33852 | 45868337 | 7255 | 626 | 8.21 |
And providing few charts (thanks to Excel):


So ideal sizing seems to be 200 i.e. not consuming too much memory and having a correct execution time. Increasing it will consume more memory on your client (maybe not an issue) and benefit is decreasing…
So why differences in the values:
- consistent gets: Extremely high with a small ARRAYSIZE. When Oracle start fetching rows, it fetches ARRAYSIZE rows (certain amount of blocks) and send them to the client. For the next bunch of ARRAYSIZE rows Oracle has to re-read the first bunch of ARRAYSIZE rows, second bunch of ARRAYSIZE rows and send them to the client and so on. That’s why with a small ARRAYSIZE there is more ping-pong between the database and the client and so more consistent gets. Means that the optimal value of ARRAYSIZE is the number of rows of your query, which could be a big amount of memory (around 50MB in our small example) or just not possible…
- bytes sent via SQL*Net to client: SQL*Net send bunch of rows in packet that have SDU size (2KB with Oracle 10g) so more ping-ping between client and server you have more chance you have to send packet not 100% full so the increase.
- bytes received via SQL*Net from client: I would say same story, client informing server that he got the requested packets and instructing it to continue processing, so smaller ARRAYSIZE and more ping-pong between client and server.
- SQL*Net roundtrips to/from client: Equal to Fetch.count (number of times a statement was fetched.), SQL*Net roundtrips to/from client and SQL*Net message from client of TKPROF output. Closest integer equal to number of rows of your query divided by ARRAYSIZE.
Remarks:
- When increasing ARRAYSIZE we also see an increase SQL*Net more data to client wait event. This event is triggered when the ARRAYSIZE rows returned to the client does not fit in one single SDU buffer, Oracle has to fill multiple SDU buffers and so this wait event.
- SQL*Net message from client gives a very good estimation of the time it took to transmit the TCP packets over the LAN/WAN but not exclusively as it also contains the Oracle processing time to arrange this transfer.
As I wrote in the beginning of this post it is nice to re-discover hot water after 10 years of Oracle experience and looking at the size of memory of actual PC I’m wondering why the default value of ARRAYSIZE is still so small…
SQL*Net further configuration
With Oracle 10g SQL*Net there are few parameters with which you can play:
- session data unit (SDU): A buffer that Oracle Net uses to place data before transmitting it across the network. Oracle Net sends the data in the buffer either when requested or when it is full.
- RECV_BUF_SIZE: Specify, in bytes, the buffer space for receive operations of sessions. This parameter is supported by the TCP/IP, TCP/IP with SSL, and SDP protocols.
- SEND_BUF_SIZE: Specify, in bytes, the buffer space for send operations of sessions. This parameter is supported by the TCP/IP, TCP/IP with SSL, and SDP protocols.
All the testing that I have done (ARRAYSIZE = 200) including SDU = 32KB and RECV_BUF_SIZE=SEND_BUF_SIZE=1000*SDU at sqlnet.ora, tnsnames.ora and listener.ora have all generated no change on bytes exchanged between server and client and a longer execution time (ok, around 1 second more only but it’s not faster)…. Apparently you may have benefit only in WAN configuration which is not my case (10MB LAN). I noticed that a SDU of 32KB on my Windows XP SP2 client generated more wait event on SQL*Net message from client…
To confirm which SDU is used you can add in your client sqlnet.ora file:
TRACE_DIRECTORY_CLIENT = C:oem10gNETWORKlog
TRACE_FILE_CLIENT = CLIENT
TRACE_LEVEL_CLIENT = 16 |
Then access to the trace files generated and look for SDU you will the SDU size used i.e. min(SDU on server, SDU on client).
You will also find references of TDU parameter (Transmission Data Unit), but it has been deprecated in Oracle Net v8.0 and beyond and is now ignored. TDU was in fact the Oracle naming for MTU (Maximum Transmission Unit) when this concept was not there. According to http://en.wikipedia.org/wiki/MTU_(networking) Wiki page the MTU for Ethernet is 1500 bytes so setting a big SDU, as I observed, should not bring any improvement. The optimal setting for SDU seems to be the size of MTU (or at least of multiple of MTU not to waste TCP packets).
Remark:
Apparently playing with those parameters in a Streams/Data Guard environment seems to provide benefit.
References
- How to Determine SDU Value Being Negotiated Between Client and Server [ID 304235.1]
- FAQ: SQL*Net Performance Tuning in Applications [ID 69591.1]
- SQL*Net Packet Sizes (SDU & TDU Parameters) [ID 44694.1]
- The relation between MTU (Maximum Transmission Unit), SDU (Session Data Unit) and TDU (Transmission Data Unit) [ID 274483.1]
- Oracle Net Performance Tuning [ID 67983.1]
- Setting SEND_BUF_SIZE and RECV_BUF_SIZE [ID 260984.1]


Amos says:
Very good. Thank you very much.