Table of contents
Preamble
For one of our Business Intelligence (BI) project we have decided to purchase a HP 365GB Multi Level Cell G2 PCIe ioDrive2 for ProLiant Servers in one of our blade server. The initial aim was to use Oracle Smart Flash Cache (db_flash_cache_file and db_flash_cache_size initialization parameters) but as the feature is available only on Oracle Enterprise Linux and Solaris (pure marketing limitation) we turn down to Veritas SmartIO.
Before we configured the Fusion I/O card I have been able to perform few tests using an I/O bench marking product.
Testing has been done using Red Hat Enterprise Linux Server release 6.4 (Santiago) and the card we have in our server is a HP ioDrive2 Blade Mezzanine Card 365 GB, HP SKU number = QK761A. The server itself has 120GB of RAM and 2 quad core sockets Intel(R) Xeon(R) CPU E5-2609 v2 @ 2.50GHz.
What Fusion I/O claim as brute performance:
| ioDrive2 365GB | |
|---|---|
| NAND Type | MLC (Multi Level Cell) |
| Read Bandwidth (1MB) | 910 MB/s |
| Write Bandwidth (1MB) | 590 MB/s |
| Ran. Read IOPS (512B) | 137,000 |
| Ran.Write IOPS (512B) | 535,000 |
| Ran. Read IOPS (4K) | 110,000 |
| Ran. Write IOPS (4K) | 140,000 |
| Read Access Latency | 68 µs |
| Write Access Latency | 15 µs |
That is a bit higher than what HP claim (HP ioDrive2 Blade Mezzanine Card 365 GB, HP SKU number = QK761A):
| ioDrive2 365GB | |
|---|---|
| NAND Type | MLC (Multi Level Cell) |
| Read max sequential throughput | 860 MB/s |
| Write max sequential throughput | 560 MB/s |
| Read IOPS (4 Kb, Q16) | 71,000 |
| Write IOPS (4 Kb, Q16) | 23,500 |
| Read average access latency (4 Kb, Q1) | 185 µs |
| Write average access latency (4 Kb, Q1) | 70 µs |
Installation
The latest Kernel I had was kernel-2.6.32-431.20.3.el6.x86_64 so I have obliged to modify Grub configuration and reboot with previous kernel as the latest available driver in zip files was:
iomemory-vsl-2.6.32-358.el6.x86_64-3.2.6.1212-1.0.el6.x86_64.rpm |
Then I have also installed:
fio-util-3.2.6.1212-1.0.el6.x86_64.rpm fio-firmware-ioaccelerator-3.2.6.20131003-1.noarch.rpm libvsl-3.2.6.1212-1.0.el6.x86_64.rpm fio-common-3.2.6.1212-1.0.el6.x86_64.rpm fio-sysvinit-3.2.6.1212-1.0.el6.x86_64.rpm |
Finally loaded the driver is memory with:
modprobe iomemory-vsl |
[root@server1 ~]# fio-status Found 1 ioMemory device in this system Driver version: 3.2.6 build 1212 Adapter: HP Adrenaline 3 Adapter HP 365GB MLC IO Accelerator for BladeSystem c-Class, Product Number:QK761A, SN:3UN340B04A External Power: NOT connected PCIe Power limit threshold: 24.75W Connected ioMemory modules: fct0: Product Number:QK761A, SN:1338D0B5C fct0 Attached HP IO Accelerator 2, SN:1338D0B5C Located in slot 0 Center of Adrenaline III Adapter SN:1340A010F PCI:23:00.0, Slot Number:2 Firmware v7.1.15, rev 110356 Public 365.00 GBytes device size Internal temperature: 43.31 degC, max 49.22 degC Reserve space status: Healthy; Reserves: 100.00%, warn at 10.00% Contained VSUs: fioa: ID:0, UUID:3d4d60ea-a338-45a9-add3-0a9d2f3618d0 fioa State: Online, Type: block device ID:0, UUID:3d4d60ea-a338-45a9-add3-0a9d2f3618d0 365.00 GBytes device size |
I wanted to detach the card to upgrade the firmware and format it (even if what format does is unclear so far) I was not able to do it (the force option is not available):
[root@server1 ~]# fio-detach /dev/fct0 Detaching: [====================] (100%) Error: failed to detach /dev/fct0: device busy. |
With fio-status -a I have been able to see that firmware was already the latest one available so gave up on this part…
Then I created a filesystem on it with:
mkfs -t ext4 /de/fioa |
And mounted it using below option, /etc/fstab:
# Fusion I/O card #/dev/fioa /mnt/fioa vxfs defaults 1 2 |
To have the ioSphere graphical interface I also installed (client and server part as I have only one test server):
fio-agent-3.7.0.181-1.0.x86_64.rpm hp-io-accel-msrv-3.7.0.181-1.0.x86_64.r |
To start server and agent part use:
fio-msrv start fio-agent start |
I initially did a simple:
mkfs -t ext4 /dev/fioa |
And mounted the device in a file system then one of my colleague challenged me stating that I should have formatted the card using VxFS to get more performances, so wanted to test this option. I’m not gonna display any ext4 performance testing result but from what I have seen VxFS is giving around 2-5% more performance. I thought it would be straightforward but encountered many issues:
[root@server1 ~]# umount /mnt/fioa [root@server1 ~]# mkfs -t vxfs -o bsize=8192,largefiles /dev/fioa UX:vxfs mkfs.vxfs: ERROR: V-3-25584: /dev/fioa is not a supported device |
Ok, I think I have to create a VxVM device group and a logical volume on it to make this working, nice refresh from old memories:
[root@server1 ~]# vxdisk -s list fioa Disk: fusionio0_0 type: auto flags: online ready private autoconfig invalid guid: - udid: FIO%5FioDrive%5FFusionIO%5F1338D0B5C site: - diskid: dgname: dgid: hostid: info: format=none [root@server1 ~]# vxdisksetup -i fusionio0_0 VxVM vxdisksetup ERROR V-5-2-0 Disk fusionio0_0 has Linux ext4 FS on it Use the '-f' flag to force the operation [root@server1 ~]# vxdisksetup -f -i fusionio0_0 VxVM vxparms ERROR V-5-1-6536 error reading partitions VxVM vxdisksetup ERROR V-5-2-43 fusionio0_0: Invalid disk device for vxdisksetup [root@server1 ~]# vxdisk init fusionio0_0 VxVM vxdisk ERROR V-5-1-5433 Device fusionio0_0: init failed: Disk Ioctl failed |
Then using fdisk /dev/fioa I have tried to correct below warning using, obviously, c, u and w:
Warning: invalid flag 0x0000 of partition table 4 will be corrected by w(rite) WARNING: DOS-compatible mode is deprecated. It's strongly recommended to switch off the mode (command 'c') and change display units to sectors (command 'u'). |
And retried:
[root@server1 ~]# vxdisksetup -i -f /dev/vx/dmp/fusionio0_0 VxVM vxdisksetup ERROR V-5-2-1118 /dev/vx/dmp/fusionio0_0: Can not get disk information. |
Strangely I discovered that full path cannot be supplied in this command, so using:
[root@server1 ~]# vxdisksetup -i -f fusionio0_0 [root@server1 ~]# vxdisk -o alldgs list|grep f fusionio0_0 auto:cdsdisk - - online ssdtrim [root@server1 ~]# fdisk -l /dev/fioa Disk /dev/fioa (Sun disk label): 16 heads, 680 sectors, 65521 cylinders Units = cylinders of 10880 * 512 bytes Device Flag Start End Blocks Id System /dev/fioa3 u 0 65521 356434240 5 Whole disk /dev/fioa8 u 0 65521 356434240 f Unknown |
The after VxVM disk initialization, VxVM device group creation:
[root@server1 ~]# vxdg init fusionio fusionio0_0 [root@server1 ~]# vxdg list fusionio Group: fusionio dgid: 1405514597.10441.server1 import-id: 1024.10440 flags: cds version: 180 alignment: 8192 (bytes) ssb: on autotagging: on detach-policy: global dg-fail-policy: obsolete ioship: off copies: nconfig=default nlog=default config: seqno=0.1027 permlen=51360 free=51357 templen=2 loglen=4096 config disk fusionio0_0 copy 1 len=51360 state=clean online log disk fusionio0_0 copy 1 len=4096 [root@server1 ~]# vxdg -g fusionio free DISK DEVICE TAG OFFSET LENGTH FLAGS fusionio0_0 fusionio0_0 fusionio0_0 0 712802688 - [root@server1 ~]# vxassist -g fusionio maxsize Maximum volume size: 712802304 (348048Mb) |
Remark
Ultra small difference in real available storage
Creation of a logical volume and mount it under a file system:
[root@server1 ~]# vxassist -g fusionio make lvol01 712802688 [root@server1 ~]# vxdg -g fusionio free VxVM vxdg INFO V-5-1-15790 No free space remaining for diskgroup fusionio [root@server1 ~]# vxassist -g fusionio maxsize VxVM vxassist ERROR V-5-1-15809 No free space remaining in diskgroup fusionio with given constraints [root@server1 ~]# mkfs -t vxfs -o bsize=8192,largefiles /dev/vx/rdsk/fusionio/lvol01 version 9 layout 712802688 sectors, 44550168 blocks of size 8192, log size 8192 blocks rcq size 1024 blocks largefiles supported [root@server1 ~]# mount -t vxfs -o delaylog,nodatainlog,convosync=direct,mincache=direct,largefiles /dev/vx/dsk/fusionio/lvol01 /mnt/fioa [root@server1 ~]# df -P /mnt/fioa Filesystem 1024-blocks Used Available Capacity Mounted on /dev/vx/dsk/fusionio/lvol01 356401344 85904 353531736 1% /mnt/fioa |
Remark:
I initially did not choose any particular mount options nor VxFS options as benchmark tool I used has an option to bypass buffered I/O (direct=1 use non-buffered I/O, usually O_DIRECT). I have performed few I/O benchmarks to compare and I have not seen any differences so the option is working well…
Finally as suggested in Fusion I/O quick installation guide I installed fio 2.1.10 benchmark to taking the RPM from http://www.rpmfind.net/linux/rpm2html/search.php?query=fio(x86-64).
Reading a bit the man page of fio I have decided to use non-buffered I/O to bypass Linux File system caching and libaio (Linux native asynchronous I/O) as ioengine.
On top of comparing with brute performance Fusion I/O and HP claim I have added the random mixed reads and writes that is closer to an Oracle database behavior in my opinion…:-)
The presented result is the best average run of multiple ones. Even if I cannot explain why some run are strangely going wild and provide results that is far from the expected average. I have also seen that the generated files if used with a different blocksize than the one for which they have been created can provide as well strange results…
Fusion I/O with VxFS
Sequential read of 1MB:
[root@server1 ~]# fio --name=files --directory=/mnt/fioa --runtime=300 --readwrite=read --size=10g --blocksize=1m --numjobs=30 --group_reporting --ioengine=libaio --direct=1 files: (g=0): rw=read, bs=1M-1M/1M-1M/1M-1M, ioengine=libaio, iodepth=1 ... fio-2.1.10 Starting 30 processes Jobs: 14 (f=14): [RR_RR___R_____RRR_____RRRRR_R_] [63.2% done] [863.0MB/0KB/0KB /s] [863/0/0 iops] [eta 02m:55s] files: (groupid=0, jobs=30): err= 0: pid=33727: Mon Jul 21 15:02:03 2014 read : io=263109MB, bw=898043KB/s, iops=876, runt=300012msec slat (usec): min=2, max=512, avg= 6.36, stdev= 5.89 clat (msec): min=2, max=86408, avg=33.40, stdev=567.24 lat (msec): min=2, max=86408, avg=33.41, stdev=567.24 clat percentiles (msec): | 1.00th=[ 6], 5.00th=[ 9], 10.00th=[ 11], 20.00th=[ 15], | 30.00th=[ 19], 40.00th=[ 23], 50.00th=[ 27], 60.00th=[ 31], | 70.00th=[ 37], 80.00th=[ 43], 90.00th=[ 52], 95.00th=[ 61], | 99.00th=[ 79], 99.50th=[ 86], 99.90th=[ 103], 99.95th=[ 110], | 99.99th=[ 147] bw (KB /s): min= 13, max=136942, per=3.91%, avg=35107.94, stdev=11757.79 lat (msec) : 4=0.12%, 10=8.75%, 20=25.86%, 50=53.74%, 100=11.39% lat (msec) : 250=0.13%, 2000=0.01%, >=2000=0.01% cpu : usr=0.01%, sys=0.03%, ctx=263123, majf=0, minf=8550 IO depths : 1=100.0%, 2=0.0%, 4=0.0%, 8=0.0%, 16=0.0%, 32=0.0%, >=64=0.0% submit : 0=0.0%, 4=100.0%, 8=0.0%, 16=0.0%, 32=0.0%, 64=0.0%, >=64=0.0% complete : 0=0.0%, 4=100.0%, 8=0.0%, 16=0.0%, 32=0.0%, 64=0.0%, >=64=0.0% issued : total=r=263109/w=0/d=0, short=r=0/w=0/d=0 latency : target=0, window=0, percentile=100.00%, depth=1 Run status group 0 (all jobs): READ: io=263109MB, aggrb=898042KB/s, minb=898042KB/s, maxb=898042KB/s, mint=300012msec, maxt=300012msec Disk stats (read/write): VxVM11000: ios=526029/23, merge=0/0, ticks=12700305/178152, in_queue=12878178, util=100.00% |
Sequential write of 1MB:
[root@server1 ~]# fio --name=files --directory=/mnt/fioa --runtime=300 --readwrite=write --size=10g --blocksize=1m --numjobs=30 --group_reporting --ioengine=libaio --direct=1 files: (g=0): rw=write, bs=1M-1M/1M-1M/1M-1M, ioengine=libaio, iodepth=1 ... fio-2.1.10 Starting 30 processes Jobs: 30 (f=30): [WWWWWWWWWWWWWWWWWWWWWWWWWWWWWW] [54.1% done] [0KB/481.0MB/0KB /s] [0/481/0 iops] [eta 04m:15s] files: (groupid=0, jobs=30): err= 0: pid=34058: Mon Jul 21 15:14:47 2014 write: io=166221MB, bw=567245KB/s, iops=553, runt=300065msec slat (usec): min=47, max=745, avg=291.29, stdev=89.11 clat (msec): min=2, max=204, avg=53.86, stdev= 3.27 lat (msec): min=2, max=204, avg=54.15, stdev= 3.28 clat percentiles (msec): | 1.00th=[ 51], 5.00th=[ 51], 10.00th=[ 52], 20.00th=[ 52], | 30.00th=[ 52], 40.00th=[ 52], 50.00th=[ 53], 60.00th=[ 53], | 70.00th=[ 55], 80.00th=[ 57], 90.00th=[ 59], 95.00th=[ 61], | 99.00th=[ 64], 99.50th=[ 66], 99.90th=[ 70], 99.95th=[ 72], | 99.99th=[ 101] bw (KB /s): min=13864, max=22000, per=3.34%, avg=18930.40, stdev=704.91 lat (msec) : 4=0.01%, 10=0.01%, 20=0.01%, 50=0.35%, 100=99.63% lat (msec) : 250=0.01% cpu : usr=0.54%, sys=0.02%, ctx=166266, majf=0, minf=813 IO depths : 1=100.0%, 2=0.0%, 4=0.0%, 8=0.0%, 16=0.0%, 32=0.0%, >=64=0.0% submit : 0=0.0%, 4=100.0%, 8=0.0%, 16=0.0%, 32=0.0%, 64=0.0%, >=64=0.0% complete : 0=0.0%, 4=100.0%, 8=0.0%, 16=0.0%, 32=0.0%, 64=0.0%, >=64=0.0% issued : total=r=0/w=166221/d=0, short=r=0/w=0/d=0 latency : target=0, window=0, percentile=100.00%, depth=1 Run status group 0 (all jobs): WRITE: io=166221MB, aggrb=567244KB/s, minb=567244KB/s, maxb=567244KB/s, mint=300065msec, maxt=300065msec Disk stats (read/write): VxVM11000: ios=0/332412, merge=0/0, ticks=0/17730170, in_queue=17731799, util=100.00% |
What can be also graphically seen with HP IO Accelerator Management Tool:
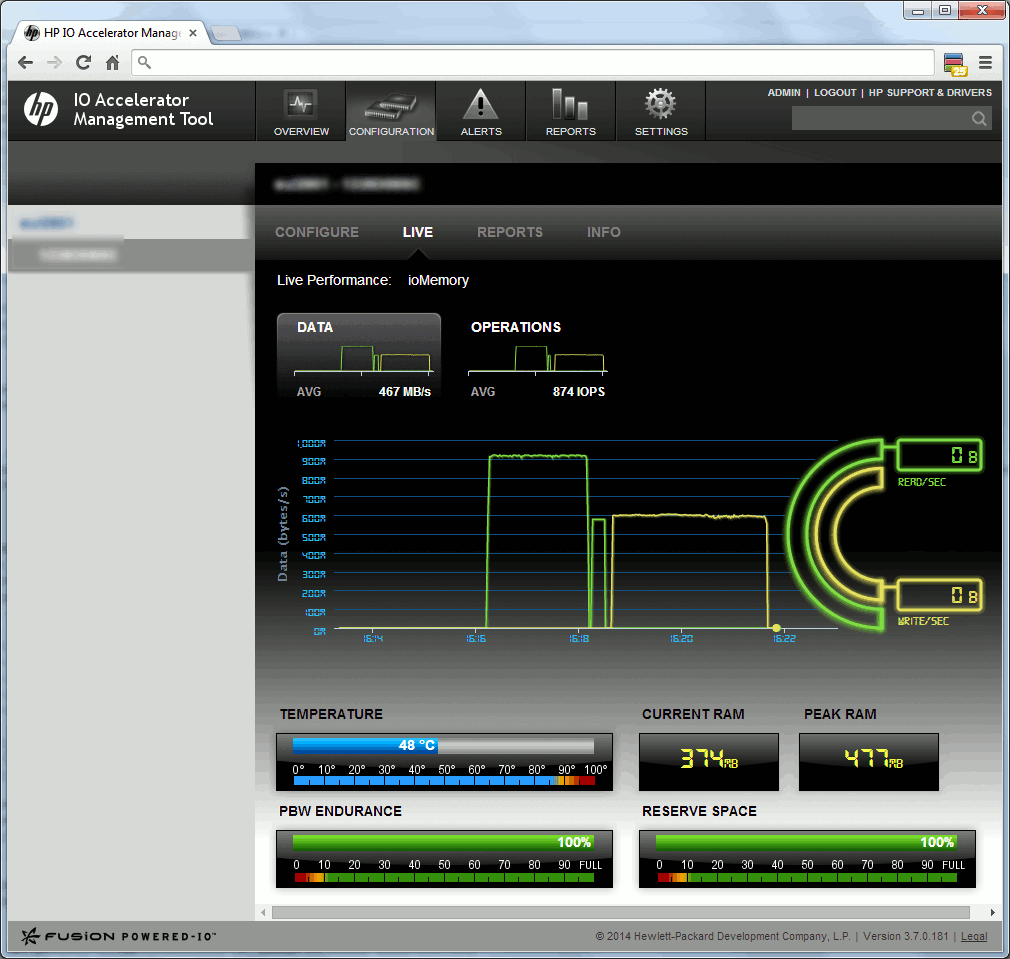
Remark:
As there are small differences I think HP IO Accelerator Management Tool is displaying in “real” MB (megabyte i.e. 1000^2) and not in the usual MB (megabyte or MiB i.e. 1024^2)
At the end with block of 1MB I almost achieve the maximum throughput i.e. 835MB for read, 554 MB for write. No need to say that this is far from a real life workload…
Sequential read of 4K:
[root@server1 ~]# fio --name=files --directory=/mnt/fioa --runtime=300 --readwrite=read --size=10g --blocksize=4k --numjobs=30 --group_reporting --ioengine=libaio --direct=1 files: (g=0): rw=read, bs=4K-4K/4K-4K/4K-4K, ioengine=libaio, iodepth=1 ... fio-2.1.10 Starting 30 processes Jobs: 30 (f=30): [RRRRRRRRRRRRRRRRRRRRRRRRRRRRRR] [100.0% done] [370.2MB/0KB/0KB /s] [94.8K/0/0 iops] [eta 00m:00s] files: (groupid=0, jobs=30): err= 0: pid=62709: Tue Jul 22 10:37:16 2014 read : io=108292MB, bw=369636KB/s, iops=92409, runt=300001msec slat (usec): min=2, max=352, avg= 6.94, stdev= 5.41 clat (usec): min=38, max=18497, avg=315.84, stdev=159.05 lat (usec): min=90, max=18503, avg=322.94, stdev=158.91 clat percentiles (usec): | 1.00th=[ 139], 5.00th=[ 163], 10.00th=[ 175], 20.00th=[ 191], | 30.00th=[ 213], 40.00th=[ 237], 50.00th=[ 262], 60.00th=[ 306], | 70.00th=[ 358], 80.00th=[ 430], 90.00th=[ 540], 95.00th=[ 636], | 99.00th=[ 812], 99.50th=[ 876], 99.90th=[ 988], 99.95th=[ 1032], | 99.99th=[ 1144] bw (KB /s): min= 7849, max=15624, per=3.33%, avg=12325.96, stdev=691.03 lat (usec) : 50=0.01%, 100=0.01%, 250=45.33%, 500=41.85%, 750=10.91% lat (usec) : 1000=1.82% lat (msec) : 2=0.07%, 4=0.01%, 10=0.01%, 20=0.01% cpu : usr=1.31%, sys=2.91%, ctx=27722931, majf=0, minf=883 IO depths : 1=100.0%, 2=0.0%, 4=0.0%, 8=0.0%, 16=0.0%, 32=0.0%, >=64=0.0% submit : 0=0.0%, 4=100.0%, 8=0.0%, 16=0.0%, 32=0.0%, 64=0.0%, >=64=0.0% complete : 0=0.0%, 4=100.0%, 8=0.0%, 16=0.0%, 32=0.0%, 64=0.0%, >=64=0.0% issued : total=r=27722807/w=0/d=0, short=r=0/w=0/d=0 latency : target=0, window=0, percentile=100.00%, depth=1 Run status group 0 (all jobs): READ: io=108292MB, aggrb=369636KB/s, minb=369636KB/s, maxb=369636KB/s, mint=300001msec, maxt=300001msec Disk stats (read/write): VxVM11000: ios=27714318/11, merge=0/0, ticks=8230869/0, in_queue=8207494, util=100.00% |
The Q16 and Q1 in Read IOPS (4 Kb, Q16) and Read average access latency (4 Kb, Q1) performance figures are unexplained to me but I have slightly different results that HP ones, more inline with the one of Fusion I/O this time. With 4KB sequential read I got 92409 IOPS and a latency of 316 µs.
Sequential write of 4K:
[root@server1 ~]# fio --name=files --directory=/mnt/fioa --runtime=300 --readwrite=write --size=10g --blocksize=4k --numjobs=30 --group_reporting --ioengine=libaio --direct=1 files: (g=0): rw=write, bs=4K-4K/4K-4K/4K-4K, ioengine=libaio, iodepth=1 ... fio-2.1.10 Starting 30 processes Jobs: 30 (f=30): [WWWWWWWWWWWWWWWWWWWWWWWWWWWWWW] [100.0% done] [0KB/435.5MB/0KB /s] [0/111K/0 iops] [eta 00m:00s] files: (groupid=0, jobs=30): err= 0: pid=57592: Thu Jul 17 09:42:58 2014 write: io=136424MB, bw=465659KB/s, iops=116414, runt=300001msec slat (usec): min=1, max=321, avg=10.35, stdev= 7.20 clat (usec): min=1, max=35258, avg=245.38, stdev=220.97 lat (usec): min=52, max=35304, avg=255.90, stdev=220.93 clat percentiles (usec): | 1.00th=[ 106], 5.00th=[ 139], 10.00th=[ 157], 20.00th=[ 181], | 30.00th=[ 197], 40.00th=[ 213], 50.00th=[ 229], 60.00th=[ 243], | 70.00th=[ 262], 80.00th=[ 282], 90.00th=[ 330], 95.00th=[ 390], | 99.00th=[ 580], 99.50th=[ 636], 99.90th=[ 1144], 99.95th=[ 5728], | 99.99th=[10816] bw (KB /s): min=10672, max=17680, per=3.33%, avg=15528.46, stdev=640.17 lat (usec) : 2=0.01%, 4=0.01%, 10=0.01%, 20=0.01%, 50=0.01% lat (usec) : 100=0.67%, 250=63.71%, 500=33.39%, 750=2.04%, 1000=0.08% lat (msec) : 2=0.02%, 4=0.02%, 10=0.06%, 20=0.01%, 50=0.01% cpu : usr=1.41%, sys=4.74%, ctx=35637317, majf=0, minf=827 IO depths : 1=100.0%, 2=0.0%, 4=0.0%, 8=0.0%, 16=0.0%, 32=0.0%, >=64=0.0% submit : 0=0.0%, 4=100.0%, 8=0.0%, 16=0.0%, 32=0.0%, 64=0.0%, >=64=0.0% complete : 0=0.0%, 4=100.0%, 8=0.0%, 16=0.0%, 32=0.0%, 64=0.0%, >=64=0.0% issued : total=r=0/w=34924535/d=0, short=r=0/w=0/d=0 latency : target=0, window=0, percentile=100.00%, depth=1 Run status group 0 (all jobs): WRITE: io=136424MB, aggrb=465658KB/s, minb=465658KB/s, maxb=465658KB/s, mint=300001msec, maxt=300001msec Disk stats (read/write): VxVM11000: ios=21/34917946, merge=0/0, ticks=5/6391626, in_queue=6328451, util=100.00% |
Same comment as before. With 4KB sequential write I got 116414 IOPS and a latency of 245 µs.
Random read of 4K:
[root@server1 ~]# fio --name=files --directory=/mnt/fioa --runtime=300 --readwrite=randread --size=10g --blocksize=4k --numjobs=30 --group_reporting --ioengine=libaio --direct=1 files: (g=0): rw=randread, bs=4K-4K/4K-4K/4K-4K, ioengine=libaio, iodepth=1 ... fio-2.1.10 Starting 30 processes Jobs: 30 (f=30): [rrrrrrrrrrrrrrrrrrrrrrrrrrrrrr] [100.0% done] [374.8MB/0KB/0KB /s] [95.1K/0/0 iops] [eta 00m:00s] files: (groupid=0, jobs=30): err= 0: pid=59221: Thu Jul 17 10:35:22 2014 read : io=111971MB, bw=382194KB/s, iops=95548, runt=300001msec slat (usec): min=2, max=346, avg= 7.29, stdev= 5.69 clat (usec): min=51, max=29179, avg=304.26, stdev=138.28 lat (usec): min=87, max=29184, avg=311.71, stdev=138.18 clat percentiles (usec): | 1.00th=[ 135], 5.00th=[ 159], 10.00th=[ 175], 20.00th=[ 199], | 30.00th=[ 221], 40.00th=[ 245], 50.00th=[ 270], 60.00th=[ 302], | 70.00th=[ 342], 80.00th=[ 398], 90.00th=[ 482], 95.00th=[ 564], | 99.00th=[ 716], 99.50th=[ 772], 99.90th=[ 884], 99.95th=[ 932], | 99.99th=[ 1128] bw (KB /s): min=10816, max=13352, per=3.33%, avg=12744.23, stdev=154.52 lat (usec) : 100=0.01%, 250=42.09%, 500=49.24%, 750=8.02%, 1000=0.62% lat (msec) : 2=0.02%, 4=0.01%, 10=0.01%, 20=0.01%, 50=0.01% cpu : usr=1.48%, sys=3.15%, ctx=28665013, majf=0, minf=942 IO depths : 1=100.0%, 2=0.0%, 4=0.0%, 8=0.0%, 16=0.0%, 32=0.0%, >=64=0.0% submit : 0=0.0%, 4=100.0%, 8=0.0%, 16=0.0%, 32=0.0%, 64=0.0%, >=64=0.0% complete : 0=0.0%, 4=100.0%, 8=0.0%, 16=0.0%, 32=0.0%, 64=0.0%, >=64=0.0% issued : total=r=28664658/w=0/d=0, short=r=0/w=0/d=0 latency : target=0, window=0, percentile=100.00%, depth=1 Run status group 0 (all jobs): READ: io=111971MB, aggrb=382194KB/s, minb=382194KB/s, maxb=382194KB/s, mint=300001msec, maxt=300001msec Disk stats (read/write): VxVM11000: ios=28657912/7, merge=0/0, ticks=8168935/0, in_queue=8143204, util=100.00% |
Random write of 4K:
[root@server1 ~]# fio --name=files --directory=/mnt/fioa --runtime=300 --readwrite=randwrite --size=10g --blocksize=4k --numjobs=30 --group_reporting --ioengine=libaio --direct=1 files: (g=0): rw=randwrite, bs=4K-4K/4K-4K/4K-4K, ioengine=libaio, iodepth=1 ... fio-2.1.10 Starting 30 processes Jobs: 30 (f=30): [wwwwwwwwwwwwwwwwwwwwwwwwwwwwww] [100.0% done] [0KB/482.5MB/0KB /s] [0/124K/0 iops] [eta 00m:00s] files: (groupid=0, jobs=30): err= 0: pid=5461: Tue Jul 22 15:27:26 2014 write: io=141570MB, bw=483225KB/s, iops=120806, runt=300001msec slat (usec): min=2, max=361, avg=10.27, stdev= 7.80 clat (usec): min=1, max=18886, avg=235.65, stdev=195.69 lat (usec): min=45, max=18904, avg=246.09, stdev=195.60 clat percentiles (usec): | 1.00th=[ 98], 5.00th=[ 129], 10.00th=[ 147], 20.00th=[ 171], | 30.00th=[ 187], 40.00th=[ 203], 50.00th=[ 217], 60.00th=[ 229], | 70.00th=[ 245], 80.00th=[ 266], 90.00th=[ 310], 95.00th=[ 378], | 99.00th=[ 684], 99.50th=[ 732], 99.90th=[ 1032], 99.95th=[ 5728], | 99.99th=[ 6816] bw (KB /s): min=11088, max=18000, per=3.33%, avg=16111.16, stdev=725.93 lat (usec) : 2=0.01%, 4=0.01%, 10=0.01%, 20=0.01%, 50=0.01% lat (usec) : 100=1.12%, 250=71.60%, 500=24.18%, 750=2.68%, 1000=0.31% lat (msec) : 2=0.01%, 4=0.01%, 10=0.08%, 20=0.01% cpu : usr=1.61%, sys=4.70%, ctx=38028601, majf=0, minf=852 IO depths : 1=100.0%, 2=0.0%, 4=0.0%, 8=0.0%, 16=0.0%, 32=0.0%, >=64=0.0% submit : 0=0.0%, 4=100.0%, 8=0.0%, 16=0.0%, 32=0.0%, 64=0.0%, >=64=0.0% complete : 0=0.0%, 4=100.0%, 8=0.0%, 16=0.0%, 32=0.0%, 64=0.0%, >=64=0.0% issued : total=r=0/w=36242014/d=0, short=r=0/w=0/d=0 latency : target=0, window=0, percentile=100.00%, depth=1 Run status group 0 (all jobs): WRITE: io=141570MB, aggrb=483225KB/s, minb=483225KB/s, maxb=483225KB/s, mint=300001msec, maxt=300001msec Disk stats (read/write): VxVM11000: ios=1/36226598, merge=0/0, ticks=0/6531861, in_queue=6474813, util=100.00% |
Mixed random read and write of 1M:
[root@server1 ~]# fio --name=files --directory=/mnt/fioa --runtime=300 --readwrite=randrw --size=10g --blocksize=1m --numjobs=30 --group_reporting --ioengine=libaio --direct=1 files: (g=0): rw=randrw, bs=1M-1M/1M-1M/1M-1M, ioengine=libaio, iodepth=1 ... fio-2.1.10 Starting 30 processes Jobs: 30 (f=30): [mmmmmmmmmmmmmmmmmmmmmmmmmmmmmm] [34.5% done] [126.0MB/167.0MB/0KB /s] [126/167/0 iops] [eta 09m:31s] files: (groupid=0, jobs=30): err= 0: pid=33339: Mon Jul 21 14:50:38 2014 read : io=54960MB, bw=187433KB/s, iops=183, runt=300262msec slat (usec): min=2, max=379269, avg=15981.97, stdev=63095.57 clat (usec): min=0, max=354420, avg=20844.16, stdev=13271.35 lat (msec): min=2, max=379, avg=36.83, stdev=59.09 clat percentiles (usec): | 1.00th=[ 1], 5.00th=[ 2], 10.00th=[ 7008], 20.00th=[11968], | 30.00th=[14784], 40.00th=[17024], 50.00th=[19328], 60.00th=[21888], | 70.00th=[24704], 80.00th=[28544], 90.00th=[35072], 95.00th=[42240], | 99.00th=[65280], 99.50th=[77312], 99.90th=[108032], 99.95th=[123392], | 99.99th=[288768] bw (KB /s): min= 1140, max=34816, per=3.54%, avg=6632.32, stdev=4081.97 write: io=52502MB, bw=179050KB/s, iops=174, runt=300262msec slat (usec): min=38, max=370268, avg=19282.13, stdev=67946.45 clat (msec): min=1, max=506, avg=113.71, stdev=58.55 lat (msec): min=2, max=507, avg=133.00, stdev=73.42 clat percentiles (msec): | 1.00th=[ 14], 5.00th=[ 45], 10.00th=[ 65], 20.00th=[ 87], | 30.00th=[ 97], 40.00th=[ 103], 50.00th=[ 108], 60.00th=[ 112], | 70.00th=[ 117], 80.00th=[ 124], 90.00th=[ 137], 95.00th=[ 269], | 99.00th=[ 355], 99.50th=[ 367], 99.90th=[ 396], 99.95th=[ 408], | 99.99th=[ 441] bw (KB /s): min= 1345, max=19768, per=3.39%, avg=6062.94, stdev=1788.28 lat (usec) : 2=1.18%, 4=1.94%, 10=0.10%, 20=0.01%, 50=0.01% lat (usec) : 100=0.01%, 250=0.01% lat (msec) : 2=0.02%, 4=0.17%, 10=5.04%, 20=19.36%, 50=24.96% lat (msec) : 100=15.43%, 250=29.04%, 500=2.75%, 750=0.01% cpu : usr=0.18%, sys=0.01%, ctx=111544, majf=0, minf=895 IO depths : 1=100.0%, 2=0.0%, 4=0.0%, 8=0.0%, 16=0.0%, 32=0.0%, >=64=0.0% submit : 0=0.0%, 4=100.0%, 8=0.0%, 16=0.0%, 32=0.0%, 64=0.0%, >=64=0.0% complete : 0=0.0%, 4=100.0%, 8=0.0%, 16=0.0%, 32=0.0%, 64=0.0%, >=64=0.0% issued : total=r=54960/w=52502/d=0, short=r=0/w=0/d=0 latency : target=0, window=0, percentile=100.00%, depth=1 Run status group 0 (all jobs): READ: io=54960MB, aggrb=187433KB/s, minb=187433KB/s, maxb=187433KB/s, mint=300262msec, maxt=300262msec WRITE: io=52502MB, aggrb=179050KB/s, minb=179050KB/s, maxb=179050KB/s, mint=300262msec, maxt=300262msec Disk stats (read/write): VxVM11000: ios=109920/104966, merge=0/0, ticks=2225189/13669617, in_queue=15899414, util=100.00% |
As a summary:
| HP ioDrive2 Blade Mezzanine Card 365 GB, HP SKU number = QK761A | |
|---|---|
| Sequential Read Bandwidth (1MB) | 877 MB/s |
| Sequential Write Bandwidth (1MB) | 554 MB/s |
| Sequential Read IOPS (4K) | 92,409 |
| Sequential Write IOPS (4K) | 116,414 |
| Random Read IOPS (4K) | 95,548 |
| Random Write IOPS (4K) | 120,806 |
| Mixed random reads and writes IOPS & bandwidth (4K) | 18762 + 18718, 75 MB/s + 75 MB/s |
| Mixed random reads and writes IOPS & bandwidth (8K) | 9527 + 9522, 76 MB/s + 76 MB/s |
| Mixed random reads and writes IOPS & bandwidth (16K) | 4976 + 4966, 79 MB/s + 79 MB/s |
| Sequential Read Access Latency (4K) | 316 µs |
| Sequential Write Access Latency (4K) | 245 µs |
With ext4 (defaults mount options) I got:
| Sequential Read Bandwidth (1MB) | 830 MB/s |
| Sequential Write Bandwidth (1MB) | 549 MB/s |
| Mixed random reads and writes IOPS & bandwidth (4K) | 16402 + 16394, 64 MB/s + 64 MB/s |
VxFS testing
No need to say that I’m a bit amazed by the throughput with a block size of 1MB, I used the below mount option to bypass the operating system file cache but the direct=1 option of fio does already the job from what I have tested:
delaylog,nodatainlog,convosync=direct,mincache=direct,largefiles |
| VxFS file system (Raid5, HP3PAR, HBA) | |
|---|---|
| Sequential Read Bandwidth (1MB) | 1153 MB/s |
| Sequential Write Bandwidth (1MB) | 1543 MB/s |
| Sequential Read IOPS (4K) | 65574 |
| Sequential Write IOPS (4K) | 34045 |
| Random Read IOPS (4K) | 5149 |
| Random Write IOPS (4K) | 13194 |
| Mixed random reads and writes IOPS & bandwidth (4K) | 3141 + 3144, 12 MB/s + 12 MB/s |
| Mixed random reads and writes IOPS & bandwidth (8K) | 3108 + 3110, 24 MB/s + 24 MB/s |
| Mixed random reads and writes IOPS & bandwidth (16K) | 3092 + 3093, 48 MB/s + 48 MB/s |
| Sequential Read Access Latency (4K) | 20 msec |
| Sequential Write Access Latency (4K) | 20 msec |
Remark:
As the array behind (HP 3PAR) is shared by multiple environments the results can be quite heretic…

 12c installation and configuration")
 tuning")

