Table of contents
Preamble
I think the below sentence from official Oracle documentation sum up very well what is Automatic SQL Tuning (task):
The DBMS_AUTO_SQLTUNE package is the interface to SQL Tuning Advisor (DBMS_SQLTUNE) when run within the Autotask framework. The database creates the automated system task SYS_AUTO_SQL_TUNING_TASK as part of the catalog scripts. This task automatically chooses a set of high-load SQL from AWR and runs the SQL Tuning Advisor on this SQL. The automated task performs the same comprehensive analysis as any other SQL Tuning task.
In other words no magic or new things behind the scene. The task is simply taking the most consuming SQL statements, criteria to choose them remains Oracle internals, and execute a SQL Tuning task using SQL Tuning Advisor (STA) that we have already seen in another post.
starting with Oracle 11.2.0.2 you have access to DBMS_AUTO_SQLTUNE package to manage automatic SQL tuning task. In 11.2.0.1 the automatic SQL tuning task is there but you had to use DBMS_SQLTUNE.REPORT_AUTO_TUNING_TASK to display its recommendations.Post has been written using Red Hat Enterprise Linux Server release 5.5 (Tikanga), Oracle 11.2.0.3 and Cloud Control 12.1.0.1.
Automated tasks
Starting with Oracle 11gR2 automated task are displayed using dedicated views and are no more lost in standard Oracle scheduler views. To get the list, and status, of automated maintenance tasks use:
SQL> SET lines 200 pages 100 SQL> SELECT client_name, status, max_duration_last_30_days FROM DBA_AUTOTASK_CLIENT; CLIENT_NAME STATUS MAX_DURATION_LAST_30_DAYS ---------------------------------------------------------------- -------- --------------------------------------------------------------------------- auto optimizer stats collection ENABLED +000 00:51:06 auto SPACE advisor DISABLED SQL tuning advisor ENABLED +000 01:00:10 |
Remark:
This view has also interesting columns of CPU used and duration of the automated tasks over the last 7 or 30 days.
How behaved Automatic SQL Tuning over last week:
SQL> SET lines 200 pages 100 SQL> SELECT job_start_time, job_status, job_duration FROM DBA_AUTOTASK_JOB_HISTORY WHERE client_name='sql tuning advisor' AND job_start_time >= SYSDATE -7 ORDER BY job_start_time DESC; JOB_START_TIME JOB_STATUS JOB_DURATION --------------------------------------------------------------------------- ------------------------------ --------------------------------------------------------------------------- 23-OCT-12 10.00.02.294336 PM EUROPE/VIENNA SUCCEEDED +000 01:00:07 22-OCT-12 10.00.02.374938 PM EUROPE/VIENNA SUCCEEDED +000 01:00:10 21-OCT-12 06.00.02.451373 AM EUROPE/VIENNA SUCCEEDED +000 00:05:42 20-OCT-12 06.00.06.518359 AM EUROPE/VIENNA SUCCEEDED +000 00:22:19 19-OCT-12 10.00.02.660040 PM EUROPE/VIENNA SUCCEEDED +000 00:17:52 18-OCT-12 10.00.02.544862 PM EUROPE/VIENNA SUCCEEDED +000 00:25:29 17-OCT-12 10.00.02.525450 PM EUROPE/VIENNA SUCCEEDED +000 00:24:41 7 ROWS selected. |
The parameters of the automatic SQL Tuning task can be changed using DBMS_AUTO_SQLTUNE.SET_AUTO_TUNING_TASK_PARAMETER procedure, the way to get current (default) parameters is not piece of cake (all is supposed to be in DBA_AUTOTASK_xx views when it’s not):
SQL> SET lines 200 pages 100 SQL> col DESCRIPTION FOR a100 SQL> col parameter_value FOR a15 SQL> SELECT parameter_name,parameter_value,is_default,description FROM DBA_ADVISOR_PARAMETERS WHERE task_name='SYS_AUTO_SQL_TUNING_TASK' ORDER BY parameter_name; PARAMETER_NAME PARAMETER_VALUE I DESCRIPTION ------------------------------ --------------- - ---------------------------------------------------------------------------------------------------- ACCEPT_SQL_PROFILES FALSE Y TRUE IF SQL Profiles should be created BY the task, FALSE otherwise APPLY_CAPTURED_COMPILENV UNUSED Y Indicated whether the advisor could USE the compilation environment captured WITH the SQL statements BASIC_FILTER UNUSED Y SQL predicate TO filter the SQL FROM the SQL Tuning SET DAYS_TO_EXPIRE UNLIMITED N The expiration TIME IN days FOR the CURRENT SQL ACCESS Advisor task DEFAULT_EXECUTION_TYPE TUNE SQL N Tune the performance OF SQL statements END_SNAPSHOT UNUSED Y The LAST snapshot id IN the analysis period END_TIME UNUSED Y The END TIME filter FOR selecting data EXECUTION_DAYS_TO_EXPIRE 30 N Specifies the expiration TIME IN days FOR individual executions OF the CURRENT task INSTANCE UNUSED Y The instance NUMBER FOR analysis JOURNALING INFORMATION Y Specifies logging OF messages TO the advisor journal LOCAL_TIME_LIMIT 1200 N TIME limit per statement IN a SQL Tuning SET MAX_AUTO_SQL_PROFILES 10000 Y Maximum NUMBER OF SYSTEM SQL Profiles that are allowable AT ANY one TIME MAX_SQL_PROFILES_PER_EXEC 20 Y Maximum NUMBER OF SQL Profiles that can be created BY the SYSTEM IN one run MODE COMPREHENSIVE Y Specifies either a LIMITED OR comprehensive analysis operation, WHERE LIMITED runs IN less TIME but may produce slightly LOWER quality results ORA_EM_PARAM1 UNUSED Y ORA_EM_PARAM10 UNUSED Y ORA_EM_PARAM2 UNUSED Y ORA_EM_PARAM3 UNUSED Y ORA_EM_PARAM4 UNUSED Y ORA_EM_PARAM5 UNUSED Y ORA_EM_PARAM6 UNUSED Y ORA_EM_PARAM7 UNUSED Y ORA_EM_PARAM8 UNUSED Y ORA_EM_PARAM9 UNUSED Y PLAN_FILTER UNUSED Y PLAN filter applicable IN CASE there are multiple plans (plan_hash_value) associated WITH the same s tatement RANK_MEASURE1 UNUSED Y A FIRST ORDER BY clause ON the selected SQL RANK_MEASURE2 UNUSED Y A SECOND ORDER BY clause ON the selected SQL RANK_MEASURE3 UNUSED Y A third ORDER BY clause ON the selected SQL RESUME_FILTER UNUSED Y Specify the DEFAULT action OF a task execution. SQL_LIMIT -1 Y Limit the NUMBER OF SQL FROM the filtered AND ranked SQL tuning SET SQL_PERCENTAGE 1 Y A percentage ON the SUM OF a ranking measure START_SNAPSHOT UNUSED Y The FIRST snapshot id IN the analysis period START_TIME UNUSED Y The START TIME filter FOR selecting data TARGET_OBJECTS 1 N Deprecated Parameter TEST_EXECUTE FULL N FULL IF SQL statements should be test-executed FOR the full local TIME limit TO measure benefit, AUT O FOR some automatically-chosen smaller TIME, AND NO FOR no test execution whatsoever TIME_LIMIT 3600 N The maximum TIME that an analysis can EXECUTE USERNAME UNUSED Y The username FOR whom the SQL statement will be tuned 37 ROWS selected. |
Remark:
One important parameter is ACCEPT_SQL_PROFILES which can make SQL Profiles acceptation automatic… Quite dangerous…
With command lines
First we may need to get begin_exec and end_exec first two parameters of DBMS_AUTO_SQLTUNE.REPORT_AUTO_TUNING_TASK procedure. Identify the task name using:
SQL> col EXECUTION_DESCRIPTION FOR a50 SQL> SELECT * FROM DBA_ADVISOR_execution_types; ADVISOR_NAME EXECUTION_TYPE EXECUTION_DESCRIPTION ------------------------------ ------------------------------ -------------------------------------------------- SQL Tuning Advisor TUNE SQL Tune the performance OF SQL statements SQL Performance Analyzer CONVERT SQLSET SQL Performance Analyzer TEST EXECUTE Test EXECUTE OF SQL statements SQL Performance Analyzer EXPLAIN PLAN Generate EXPLAIN PLAN OF SQL statements SQL Performance Analyzer COMPARE PERFORMANCE ANALYZE performance OF SQL statements SQL Repair Advisor SQL DIAGNOSIS 6 ROWS selected. SQL> col DESCRIPTION FOR a50 SQL> SELECT task_name,description,execution_type FROM DBA_Advisor_TASKs WHERE advisor_name='SQL Tuning Advisor'; TASK_NAME DESCRIPTION EXECUTION_TYPE ------------------------------ -------------------------------------------------- ------------------------------ SYS_AUTO_SQL_TUNING_TASK Automatic SQL Tuning Task TUNE SQL |
Then display execution names using:
SQL> col error_message FOR a70 SQL> SET lines 200 pages 1000 SQL> SELECT execution_name,TO_CHAR(execution_start,'dd-mon-yyyy hh24:mi:ss') AS execution_start, status,error_message FROM DBA_ADVISOR_EXECUTIONS WHERE task_name='SYS_AUTO_SQL_TUNING_TASK' ORDER BY execution_id DESC; EXECUTION_NAME EXECUTION_START STATUS ERROR_MESSAGE ------------------------------ ----------------------------- ----------- ---------------------------------------------------------------------- EXEC_19911 23-oct-2012 22:00:03 INTERRUPTED ORA-13639: The CURRENT operation was interrupted because it timed OUT. EXEC_19882 22-oct-2012 22:00:03 INTERRUPTED ORA-13639: The CURRENT operation was interrupted because it timed OUT. EXEC_19785 21-oct-2012 06:00:03 COMPLETED EXEC_19759 20-oct-2012 06:00:08 COMPLETED EXEC_19750 19-oct-2012 22:00:03 COMPLETED EXEC_19721 18-oct-2012 22:00:03 COMPLETED . . |
Remark:
Please note that in this view we can see that task has been timeout the last two days while in DBA_AUTOTASK_JOB_HISTORY we have feeling that all is in success…
Then to generate a text report (level and section parameters may take other values):
SQL> SET lines 200 pages 1000 SQL> SET LONG 999999999 SQL> SELECT DBMS_AUTO_SQLTUNE.REPORT_AUTO_TUNING_TASK('EXEC_19911','EXEC_19911','TEXT','ALL','SUMMARY') FROM dual; DBMS_AUTO_SQLTUNE.REPORT_AUTO_TUNING_TASK('EXEC_19911','EXEC_19911','TEXT','ALL' -------------------------------------------------------------------------------- GENERAL INFORMATION SECTION ------------------------------------------------------------------------------- Tuning Task Name : SYS_AUTO_SQL_TUNING_TASK Tuning Task Owner : SYS Tuning Task ID : 1 Workload TYPE : Automatic High-Load SQL Workload Execution COUNT : 32 CURRENT Execution : EXEC_19911 Execution TYPE : TUNE SQL Scope : COMPREHENSIVE Global TIME Limit(seconds) : 3600 Per-SQL TIME Limit(seconds) : 1200 Completion Status : INTERRUPTED Started AT : 10/23/2012 22:00:03 Completed AT : 10/23/2012 23:00:09 NUMBER OF Candidate SQLs : 237 Cumulative Elapsed TIME OF SQL (s) : 200578 ------------------------------------------------------------------------------- Error: ORA-13639: The CURRENT operation was interrupted because it timed OUT. ------------------------------------------------------------------------------- ------------------------------------------------------------------------------- SUMMARY SECTION ------------------------------------------------------------------------------- Global SQL Tuning Result STATISTICS ------------------------------------------------------------------------------- NUMBER OF SQLs Analyzed : 137 NUMBER OF SQLs IN the Report : 137 NUMBER OF SQLs WITH Findings : 22 NUMBER OF SQLs WITH Alternative PLAN Findings: 12 NUMBER OF SQLs WITH SQL profiles recommended : 13 NUMBER OF SQLs WITH INDEX Findings : 9 NUMBER OF SQLs WITH SQL Restructure Findings : 5 NUMBER OF SQLs WITH Timeouts : 1 ------------------------------------------------------------------------------- SQLs WITH Findings Ordered BY Maximum (PROFILE/INDEX) Benefit, Object ID ------------------------------------------------------------------------------- object ID SQL ID STATISTICS PROFILE(benefit) INDEX(benefit) restructure ---------- ------------- ---------- ---------------- -------------- ----------- 62464 asrjufk4rqp9w 98.26% 99.99% 62455 0pf7p39v3837f 99.98% 99.96% 62465 cjsw4bgt5rkt6 99.98% 99.97% 62466 cbh423x0ckcuh 99.98% 99.97% 62467 2zrxuz81p05v9 99.98% 99.97% 62468 02kvj08z7vbs1 99.98% 99.97% 62469 8shsznktrr50m 99.98% 99.97% 62344 gg6ahka0dhnkg 99.42% 4 62458 5taf298vqzh4j 98.03% 62437 f1d19p5kd70bb 94.64% 1 62435 cnvcujdjxm78y 94.36% 50.84% 1 62473 aqbjxy8zj2hjd 91.01% 62446 9m5ha7jvc615y 86.11% 1 62479 g40ubdmj8kz4v 37.75% 1 62456 cnfxrms8zwkxr 62471 719unza2x3nrs 62472 5uns34fj8xmg3 62474 101ksavbfw2nq 62475 1tcfp9zm7gsz3 62476 9t5dmqb6untmx 62477 c6m7bjmmw6n3c ------------------------------------------------------------------------------- Tables WITH NEW Potential Indices (ordered BY SCHEMA, NUMBER OF times, TABLE) ------------------------------------------------------------------------------- SCHEMA Name TABLE Name INDEX Name Nb TIME --------------------------- --------------------------- -------------- -------- DATALOAD CUSTOMER IDX$$_00010009 6 MN_HIST_TASK IDX$$_0001000D 1 ORG IDX$$_00010005 1 PRODUCT_FAMILY IDX$$_00010006 1 REPORT_TYPE_COLUMN IDX$$_0001000B 1 ------------------------------------------------------------------------------- |
you may also use something like:
VARIABLE report CLOB; BEGIN :report:=DBMS_SQLTUNE.report_auto_tuning_task(begin_exec=>'EXEC_19911', end_exec=>'EXEC_19911', LEVEL=>'ALL', section=>'SUMMARY'); END; / SET LONG 999999999 PRINT :report |
Remark:
What’s nasty is that reports can be generated only in text format and you can’t have something well organized with hyper links in html. Which make use of Cloud Control almost mandatory…
We can anyway dig a bit in sql_id using something like (example on first sql_id and so first object_id which has SQL Profile and index findings):
SQL> SET lines 200 pages 1000 SQL> SET LONG 999999999 SQL> SET longchunksize 200 SQL> SELECT DBMS_AUTO_SQLTUNE.REPORT_AUTO_TUNING_TASK('EXEC_19911','EXEC_19911','TEXT','ALL','ALL',62464) FROM dual DBMS_AUTO_SQLTUNE.REPORT_AUTO_TUNING_TASK('EXEC_19911','EXEC_19911','TEXT','ALL','ALL',62464) -------------------------------------------------------------------------------------------------------------------------------------------------------------------------------------------------------- GENERAL INFORMATION SECTION ------------------------------------------------------------------------------- Tuning Task Name : SYS_AUTO_SQL_TUNING_TASK Tuning Task Owner : SYS Tuning Task ID : 1 Workload TYPE : Automatic High-Load SQL Workload Execution COUNT : 32 CURRENT Execution : EXEC_19911 Execution TYPE : TUNE SQL Scope : COMPREHENSIVE Global TIME Limit(seconds) : 3600 Per-SQL TIME Limit(seconds) : 1200 Completion Status : INTERRUPTED Started AT : 10/23/2012 22:00:03 Completed AT : 10/23/2012 23:00:09 NUMBER OF Candidate SQLs : 237 Cumulative Elapsed TIME OF SQL (s) : 200578 ------------------------------------------------------------------------------- Error: ORA-13639: The CURRENT operation was interrupted because it timed OUT. ------------------------------------------------------------------------------- ------------------------------------------------------------------------------- Object ID : 62464 SCHEMA Name: SYS SQL ID : asrjufk4rqp9w SQL Text : SELECT /*+ all_rows */ COUNT(1) FROM "DATALOAD"."MN_HIST_TASK" WHERE "MEMBER_ID_CREATED" = :1 ------------------------------------------------------------------------------- FINDINGS SECTION (2 findings) ------------------------------------------------------------------------------- 1- SQL PROFILE Finding (see EXPLAIN plans section below) -------------------------------------------------------- A potentially better execution PLAN was found FOR this statement. Recommendation (estimated benefit: 98.26%) ------------------------------------------ - Consider accepting the recommended SQL PROFILE TO USE parallel execution FOR this statement. EXECUTE dbms_sqltune.accept_sql_profile(task_name => 'SYS_AUTO_SQL_TUNING_TASK', object_id => 62464, REPLACE => TRUE, profile_type => DBMS_SQLTUNE.PX_PROFILE); Executing this query parallel WITH DOP 64 will improve its response TIME 98.27% over the original PLAN. However, there IS some COST IN enabling parallel execution. It will increase the statement's resource consumption by an estimated 11.00% which may result in a reduction of system throughput. Also, because these resources are consumed over a much smaller duration, the response time of concurrent statements might be negatively impacted if sufficient hardware capacity is not available. The following data shows some sampled statistics for this SQL from the past week and projected weekly values when parallel execution is enabled. Past week sampled statistics for this SQL ----------------------------------------- Number of executions 0 Percent of total activity 0 Percent of samples with #Active Sessions > 2*CPU 0 Weekly DB time (in sec) 0 Projected statistics with Parallel Execution -------------------------------------------- Weekly DB time (in sec) 0 2- Index Finding (see explain plans section below) -------------------------------------------------- The execution plan of this statement can be improved by creating one or more indices. Recommendation (estimated benefit: 99.99%) ------------------------------------------ - Consider running the Access Advisor to improve the physical schema design or creating the recommended index. create index DATALOAD.IDX$$_0001000D on DATALOAD.MN_HIST_TASK("MEMBER_ID_CREATED"); Rationale --------- Creating the recommended indices significantly improves the execution plan of this statement. However, it might be preferable to run "Access Advisor" using a representative SQL workload as opposed to a single statement. This will allow to get comprehensive index recommendations which takes into account index maintenance overhead and additional space consumption. ------------------------------------------------------------------------------- EXPLAIN PLANS SECTION ------------------------------------------------------------------------------- 1- Original ----------- Plan hash value: 1159508356 ----------------------------------------------------------------------------------- | Id | Operation | Name | Rows | Bytes | Cost (%CPU)| Time | ----------------------------------------------------------------------------------- | 0 | SELECT STATEMENT | | 1 | 13 | 16464 (1)| 00:03:18 | | 1 | SORT AGGREGATE | | 1 | 13 | | | |* 2 | TABLE ACCESS FULL| MN_HIST_TASK | 1 | 13 | 16464 (1)| 00:03:18 | ----------------------------------------------------------------------------------- Query Block Name / Object Alias (identified by operation id): ------------------------------------------------------------- 1 - SEL$1 2 - SEL$1 / MN_HIST_TASK@SEL$1 Predicate Information (identified by operation id): --------------------------------------------------- 2 - filter("MEMBER_ID_CREATED"=:1) Column Projection Information (identified by operation id): ----------------------------------------------------------- 1 - (#keys=0) COUNT(*)[22] 2- Using New Indices -------------------- Plan hash value: 3895781544 ------------------------------------------------------------------------------------ | Id | Operation | Name | Rows | Bytes | Cost (%CPU)| Time | ------------------------------------------------------------------------------------ | 0 | SELECT STATEMENT | | 1 | 13 | 1 (0)| 00:00:01 | | 1 | SORT AGGREGATE | | 1 | 13 | | | |* 2 | INDEX RANGE SCAN| IDX$$_0001000D | 1 | 13 | 1 (0)| 00:00:01 | ------------------------------------------------------------------------------------ Query Block Name / Object Alias (identified by operation id): ------------------------------------------------------------- 1 - SEL$1 2 - SEL$1 / MN_HIST_TASK@SEL$1 Predicate Information (identified by operation id): --------------------------------------------------- 2 - access("MEMBER_ID_CREATED"=:1) Column Projection Information (identified by operation id): ----------------------------------------------------------- 1 - (#keys=0) COUNT(*)[22] 3- Using Parallel Execution --------------------------- Plan hash value: 2132902461 -------------------------------------------------------------------------------------------------------------------- | Id | Operation | Name | Rows | Bytes | Cost (%CPU)| Time | TQ |IN-OUT| PQ Distrib | -------------------------------------------------------------------------------------------------------------------- | 0 | SELECT STATEMENT | | 1 | 13 | 286 (1)| 00:00:04 | | | | | 1 | SORT AGGREGATE | | 1 | 13 | | | | | | | 2 | PX COORDINATOR | | | | | | | | | | 3 | PX SEND QC (RANDOM) | :TQ10000 | 1 | 13 | | | Q1,00 | P->S | QC (RAND) | | 4 | SORT AGGREGATE | | 1 | 13 | | | Q1,00 | PCWP | | | 5 | PX BLOCK ITERATOR | | 1 | 13 | 286 (1)| 00:00:04 | Q1,00 | PCWC | | |* 6 | TABLE ACCESS FULL| MN_HIST_TASK | 1 | 13 | 286 (1)| 00:00:04 | Q1,00 | PCWP | | -------------------------------------------------------------------------------------------------------------------- Query Block Name / Object Alias (identified by operation id): ------------------------------------------------------------- 1 - SEL$1 6 - SEL$1 / MN_HIST_TASK@SEL$1 Predicate Information (identified by operation id): --------------------------------------------------- 6 - filter("MEMBER_ID_CREATED"=:1) Column Projection Information (identified by operation id): ----------------------------------------------------------- 1 - (#keys=0) COUNT()[22] 2 - SYS_OP_MSR()[10] 3 - (#keys=0) SYS_OP_MSR()[10] 4 - (#keys=0) SYS_OP_MSR()[10] Note ----- - automatic DOP: skipped because of IO calibrate statistics are missing ------------------------------------------------------------------------------- |
Even if the display is readable we are at few years light from an html output…
With Cloud Control
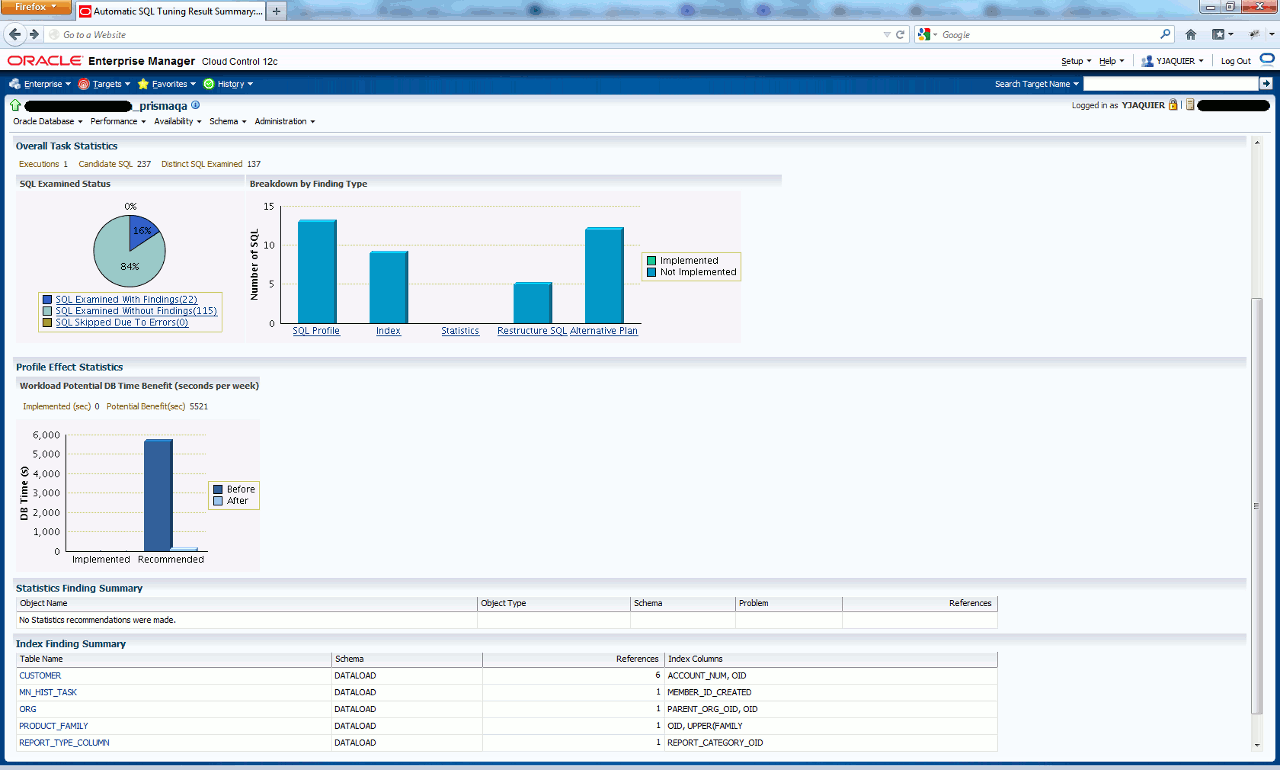
Even if Cloud Control installation and configuration requires a bit of work the added value is then clearly shown in below screen shots, first the task overview with graphics:

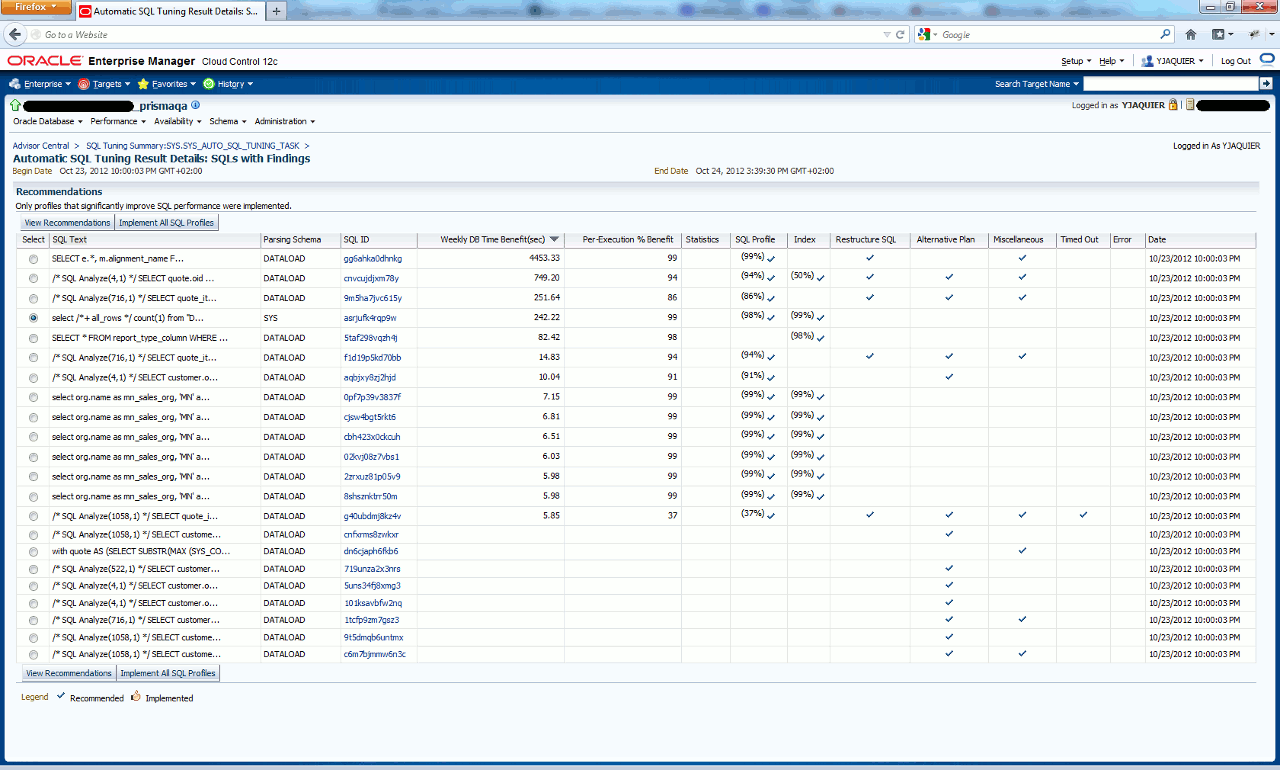
if you click on SQL examined with findings hyper link:

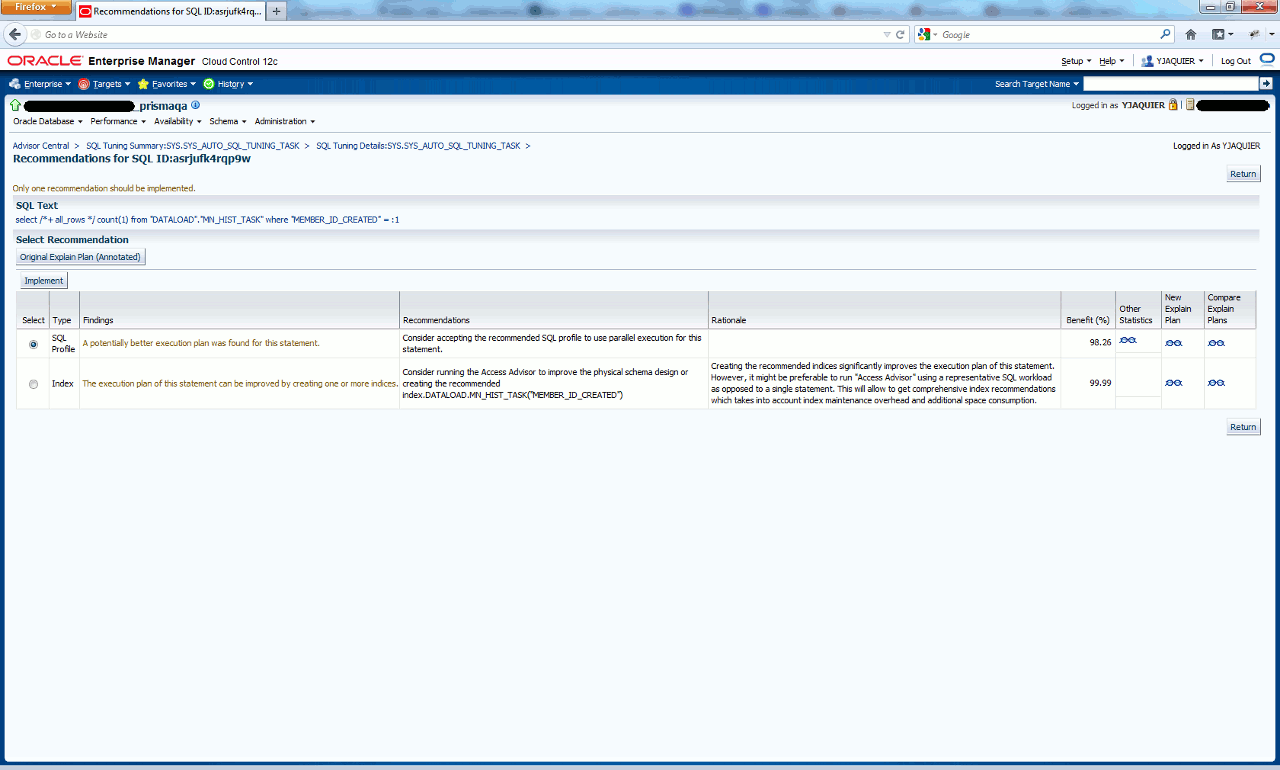
If you display recommendations for same sql_id we have seen with command lines:

References
- Automatic SQL Tune Job Fails With ORA-13639 [ID 1363111.1]


Ravin Maharaj says:
Great article. How do change the date format when using DBMS_SQLTUNE.report_auto_tuning_task and how can you change the format of the report so that the lines do not wrap ?
Yannick Jaquier says:
Thanks !
Have you tried ALTER SESSION SET nls_date_format=’xxx’ and set linesize ?
sneha jadhav says:
Hello Yannick,
Thanks for the reply . I would like to know if we should blindly follow the recommendations given by Oracle through the below command:
SELECT DBMS_SQLTUNE.REPORT_TUNING_TASK(
‘SYS_AUTO_SQL_TUNING_TASK’)
FROM DUAL;
Like I got recommendations to accept profile and create indices .I want to know if I create indices , will that not have side effects .Thanks in advance .
Sneha Jadhav
Yannick Jaquier says:
Hello Sneha,
No you should never follow blindly any of the advisors’ recommendations.
The example you give on indices is a good one. Creating indices is obviously impacting all the DML on master table…
Thanks, Yannick.
sneha says:
Hi Yannick,
Please tell me if there is any provision to make this ‘SYS_AUTO_SQL_TUNING_TASK’ to run on weekly basis.
Right now this task is running daily in my Prod database for 60 mins which is causing performance issues.
Thanks,
Sneha Jadhav
Yannick Jaquier says:
Hi Sneha,
Thanks for stopping by…
You may ask confirmation to Oracle but in my opinion there is no harm to set this auto task weekly or even deactivate it if you never check the result. Personally I always deactivate by default for segment advisor that is an heavy resources consumer…
Either you do it with graphical interface in Cloud Control or using something like (Monday window example), you may as well create new running windows:
Thanks, Yannick.