Table of contents
Preamble
Our BI database has been migrated to 11gR2 end of 2014 (better late than never), so few months before the end of premium support. Since we migrated to 10gR2 they have always had below trigger to have few account still using the 9i optimizer (!!):
CREATE OR REPLACE TRIGGER sys.new_logon_trig AFTER LOGON ON DATABASE DECLARE sqlstr VARCHAR2(200) := 'ALTER SESSION SET OPTIMIZER_FEATURES_ENABLE=''9.2.0'''; BEGIN FOR cur IN (SELECT grantee FROM sys.dba_rsrc_consumer_group_privs WHERE granted_group='BO_UNIVERSE_GROUP') LOOP IF USER = cur.username THEN EXECUTE IMMEDIATE sqlstr; END IF; END LOOP; END new_logon_trig; |
And yes we have Database Resource Manager (DBRM) in action to limit reporting users (end users accessing directly the database and BO universe accounts) with below setup (extracted from SQL Developer as Cloud Control 12cR4 has a bug and does not display maximum execution time parameter):
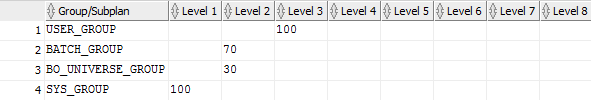

And yes 43200 seconds is 12 hours which has no interest. I initially set it to 45 minutes but it badly deviated over time…
When we moved to 11gR2 I have reasonably argued that keeping the 9i optimizer was most probably not the best idea and BI team has started to work to remove the trigger (in fact they moved accounts one by one out of 9i optimizer using a different table than the database resource manager one). One of the (bad) reason they kept 9i optimizer was the GROUP BY that was not sorting any more result and the need to modify queries to add ORDER BY.
And guess what a query that was running in around 4 minutes with 9i optimizer is now failing for:
SQL> @query1 UBCK_USERS.AFINISHED_GOOD, * ERROR AT line 26: ORA-07455: estimated execution TIME (158931 secs), exceeds limit (43200 secs) |
158931 seconds is 44,1475 hours !!!
Testing has been done on Oracle database Enterprise edition 11.2.0.4 running on HPUX 11.31. The query in itself fit on a A4 page but has no particular interest to be displayed here…
Optimizer differences
I executed myself the query using BO universe account with statistics_level=all, set autotrace traceonly explain statistics and with:
SQL> SET lines 200 pages 1000 SQL> SELECT * FROM TABLE(DBMS_XPLAN.DISPLAY_CURSOR('a4v04fdrzt14s','0','all allstats')) |
We have already seen multiple times how to generate below explain plan :
--------------------------------------------------------------------------------------------------------------------------------------------------------------- | Id | Operation | Name | E-ROWS |E-Bytes|E-Temp | COST (%CPU)| E-TIME | Pstart| Pstop | OMem | 1Mem | O/1/M | --------------------------------------------------------------------------------------------------------------------------------------------------------------- | 0 | SELECT STATEMENT | | | | | 14M(100)| | | | | | | | 1 | HASH GROUP BY | | 299 | 91793 | 2479M| 14M (1)| 43:21:37 | | | 274M| 15M| 1/0/0| |* 2 | FILTER | | | | | | | | | | | | |* 3 | HASH JOIN | | 6981K| 2043M| 7300K| 369K (2)| 01:07:50 | | | 10M| 2310K| 1/0/0| | 4 | TABLE ACCESS BY INDEX ROWID| AFINISHED_GOOD | 51906 | 6691K| | 9728 (1)| 00:01:48 | | | | | | |* 5 | INDEX RANGE SCAN | AFINISHED_GOOD_IDX_PGRP | 51906 | | | 52 (2)| 00:00:01 | | | | | | |* 6 | HASH JOIN | | 7067K| 1179M| 50M| 291K (2)| 00:53:29 | | | 75M| 5505K| 1/0/0| | 7 | TABLE ACCESS FULL | ACUSTOMER_SHIP_TO | 772K| 41M| | 42001 (1)| 00:07:43 | | | | | | | 8 | PARTITION RANGE ALL | | 7022K| 796M| | 199K (2)| 00:36:35 | 1 | 12 | | | | |* 9 | TABLE ACCESS FULL | HINVOICE | 7022K| 796M| | 199K (2)| 00:36:35 | 1 | 12 | | | | |* 10 | TABLE ACCESS BY INDEX ROWID | USER_X_ORG | 1 | 55 | | 2 (0)| 00:00:01 | | | | | | |* 11 | INDEX RANGE SCAN | USER_X_ORG_IDX_NAME | 2 | | | 1 (0)| 00:00:01 | | | | | | --------------------------------------------------------------------------------------------------------------------------------------------------------------- |
I have also noted the warning at the bottom of explain plan:
Note ----- - cpu costing IS off (consider enabling it) |
So yes 11g optimizer is estimating the query to run for close to 44 hours so the expected restriction of the Database Resource Manager (DBRM)…
The explain plan in 9i is:
-------------------------------------------------------------------------------------------------------------------------------------------------------------------------------------------------------------- | Id | Operation | Name | Starts | E-ROWS |E-Bytes|E-Temp | COST | Pstart| Pstop | A-ROWS | A-TIME | Buffers | Reads | Writes | OMem | 1Mem | O/1/M | Max-Tmp | -------------------------------------------------------------------------------------------------------------------------------------------------------------------------------------------------------------- | 0 | SELECT STATEMENT | | 2 | | | | 209K| | | 71574 |00:04:16.16 | 4658K| 574K| 126K| | | | | | 1 | SORT GROUP BY | | 2 | 349K| 102M| 247M| 209K| | | 71574 |00:04:16.16 | 4658K| 574K| 126K| 12M| 4667K| 2/0/0| | |* 2 | FILTER | | 2 | | | | | | | 1001K|00:02:30.12 | 651K| 574K| 126K| | | | | |* 3 | HASH JOIN | | 2 | 349K| 102M| 7300K| 177K| | | 1001K|00:02:27.57 | 472K| 574K| 126K| 10M| 2310K| 2/0/0| | |* 4 | TABLE ACCESS FULL | AFINISHED_GOOD | 2 | 51906 | 6691K| | 9366 | | | 112K|00:00:08.36 | 49272 | 24624 | 0 | | | | | |* 5 | HASH JOIN | | 2 | 353K| 58M| 43M| 166K| | | 5357K|00:02:12.99 | 423K| 550K| 126K| 437M| 18M| | 355K| | 6 | PARTITION RANGE ALL | | 2 | 351K| 39M| | 136K| 1 | 12 | 5357K|00:01:00.00 | 271K| 271K| 0 | | | | | |* 7 | TABLE ACCESS FULL | HINVOICE | 24 | 351K| 39M| | 136K| 1 | 12 | 5357K|00:00:57.53 | 271K| 271K| 0 | | | | | | 8 | TABLE ACCESS FULL | ACUSTOMER_SHIP_TO | 2 | 772K| 41M| | 28887 | | | 1545K|00:00:38.49 | 152K| 152K| 0 | | | | | |* 9 | TABLE ACCESS BY INDEX ROWID| USER_X_ORG | 89393 | 1 | 55 | | 3 | | | 89393 |00:00:00.98 | 178K| 1 | 0 | | | | | |* 10 | INDEX RANGE SCAN | USER_X_ORG_IDX_NAME | 89393 | 4 | | | 1 | | | 89393 |00:00:00.56 | 89403 | 0 | 0 | | | | | -------------------------------------------------------------------------------------------------------------------------------------------------------------------------------------------------------------- |
Note the SORT GROUP BY instead of HASH GROUP BY that is also sorting the result. This to say that if sorting is important then query should also be rewritten in 11g…
We also note completely different cost in 9i (estimated time is also not displayed).
I have also tried to execute the query with my own account (I’m in SYS_GROUP) and got below result:
---------------------------------------------------------------------------------------------------------------------------------------------------------------------------------------------------------------- | Id | Operation | Name | Starts | E-ROWS |E-Bytes|E-Temp | COST (%CPU)| E-TIME | Pstart| Pstop | A-ROWS | A-TIME | Buffers | Reads | OMem | 1Mem | O/1/M | ---------------------------------------------------------------------------------------------------------------------------------------------------------------------------------------------------------------- | 0 | SELECT STATEMENT | | 1 | | | | 14M(100)| | | | 92337 |00:04:01.93 | 7137K| 439K| | | | | 1 | HASH GROUP BY | | 1 | 300 | 105K| 2747M| 14M (3)| 43:21:37 | | | 92337 |00:04:01.93 | 7137K| 439K| 741M| 15M| 1/0/0| |* 2 | FILTER | | 1 | | | | | | | | 1348K|00:01:32.92 | 910K| 439K| | | | |* 3 | HASH JOIN | | 1 | 7034K| 2421M| 7884K| 444K (15)| 01:07:50 | | | 1348K|00:01:28.31 | 455K| 439K| 10M| 2310K| 1/0/0| | 4 | TABLE ACCESS BY INDEX ROWID| AFINISHED_GOOD | 1 | 48035 | 7317K| | 9249 (3)| 00:00:06 | | | 56160 |00:00:00.32 | 16300 | 0 | | | | |* 5 | INDEX RANGE SCAN | AFINISHED_GOOD_IDX_PGRP | 1 | 48035 | | | 62 (25)| 00:00:01 | | | 56160 |00:00:00.04 | 56 | 0 | | | | |* 6 | HASH JOIN | | 1 | 7120K| 1391M| 72M| 351K (17)| 00:53:29 | | | 7120K|00:01:19.96 | 439K| 439K| 75M| 5505K| 1/0/0| | 7 | TABLE ACCESS FULL | ACUSTOMER_SHIP_TO | 1 | 773K| 63M| | 46906 (12)| 00:07:43 | | | 772K|00:00:09.96 | 76121 | 76115 | | | | | 8 | PARTITION RANGE ALL | | 1 | 7120K| 808M| | 249K (21)| 00:36:35 | 1 | 24 | 7120K|00:00:56.51 | 363K| 363K| | | | |* 9 | TABLE ACCESS FULL | HINVOICE | 24 | 7120K| 808M| | 249K (21)| 00:36:35 | 1 | 24 | 7120K|00:00:53.13 | 363K| 363K| | | | |* 10 | TABLE ACCESS BY INDEX ROWID | USER_X_ORG | 227K| 1 | 55 | | 2 (0)| 00:00:01 | | | 227K|00:00:02.18 | 455K| 0 | | | | |* 11 | INDEX RANGE SCAN | USER_X_ORG_IDX_NAME | 227K| 2 | | | 1 (0)| 00:00:01 | | | 227K|00:00:01.17 | 227K| 0 | | | | ---------------------------------------------------------------------------------------------------------------------------------------------------------------------------------------------------------------- |
Estimated time is completely wrong (E-Time) while real execution time (A-Time) is even faster than with 9i optimizer (my account is also not restricted on parallel processing).
System statistics
My investigation on cpu costing is off (consider enabling it) have driven me to system statistics (funnily I was working on this for a problem on another database) and discovered we have not updated them since at least Oracle 9i:
SQL> SET lines 200 pages 1000 SQL> col PVAL2 FOR a40 SQL> SELECT * FROM SYS.AUX_STATS$; SNAME PNAME PVAL1 PVAL2 ------------------------------ ------------------------------ ---------- ---------------------------------------- SYSSTATS_INFO STATUS COMPLETED SYSSTATS_INFO DSTART 08-06-2009 11:24 SYSSTATS_INFO DSTOP 08-06-2009 11:24 SYSSTATS_INFO FLAGS 1 SYSSTATS_MAIN CPUSPEEDNW 1020.94011 SYSSTATS_MAIN IOSEEKTIM 10 SYSSTATS_MAIN IOTFRSPEED 4096 SYSSTATS_MAIN SREADTIM SYSSTATS_MAIN MREADTIM SYSSTATS_MAIN CPUSPEED SYSSTATS_MAIN MBRC SYSSTATS_MAIN MAXTHR SYSSTATS_MAIN SLAVETHR 13 ROWS selected. |
I started by exporting them in a table just to be able to recover the situation in case of:
SQL> EXEC dbms_stats.create_stat_table('yjaquier','system_stats01'); PL/SQL PROCEDURE successfully completed. SQL> EXEC dbms_stats.export_system_stats('system_stats01','original_system_stats','yjaquier'); PL/SQL PROCEDURE successfully completed. |
In case of any issue the system statistics can be re-imported back with DBMS_STATS.IMPORT_SYSTEM_STATS procedure.
To gather system statistics the procedure to use is DBMS_STATS.GATHER_SYSTEM_STATS. The NOWORKLOAD gathering mode option did not set the SREADTIM and MREADTIM parameters. I initially thought INTERVAL gathering mode option too but after further test it was related to no activity onto my database. Looking at official documentation it looks some parameters are set only with NOWORKLOAD gathering mode option. Having activity onto your database when you gather system statistics is a key point or Oracle will not able to set system parameters related to I/O for example…
I finally decided to use START/STOP gathering mode option, and I let it run for 2 hours. As we have seen above the table to check is SYS.AUX_STATS$:
SQL> EXEC DBMS_STATS.GATHER_SYSTEM_STATS('START'); PL/SQL PROCEDURE successfully completed. SQL> SELECT * FROM SYS.AUX_STATS$; SNAME PNAME PVAL1 PVAL2 ------------------------------ ------------------------------ ---------- ---------------------------------------- SYSSTATS_INFO STATUS MANUALGATHERING SYSSTATS_INFO DSTART 08-18-2015 15:06 SYSSTATS_INFO DSTOP 08-18-2015 15:06 SYSSTATS_INFO FLAGS 1 SYSSTATS_MAIN CPUSPEEDNW 1020.94011 SYSSTATS_TEMP SBLKRDS 4605025788 SYSSTATS_TEMP SBLKRDTIM 4476692903 SYSSTATS_TEMP MBLKRDS 1384364385 SYSSTATS_TEMP MBLKRDTIM 886733794 SYSSTATS_TEMP CPUCYCLES 149179884 SYSSTATS_TEMP CPUTIM 139808514 SYSSTATS_TEMP JOB 0 SYSSTATS_TEMP CACHE_JOB 3875 SYSSTATS_TEMP MBRTOTAL 9665735981 SYSSTATS_MAIN IOSEEKTIM 10 SYSSTATS_MAIN IOTFRSPEED 4096 SYSSTATS_MAIN SREADTIM SYSSTATS_MAIN MREADTIM SYSSTATS_MAIN CPUSPEED SYSSTATS_MAIN MBRC SYSSTATS_MAIN MAXTHR SYSSTATS_MAIN SLAVETHR 22 ROWS selected. |
Then I confirmed I had a bit of activity onto the database while system statistics gathering was running.
SQL> EXEC DBMS_STATS.GATHER_SYSTEM_STATS('STOP'); PL/SQL PROCEDURE successfully completed. SQL> SELECT * FROM SYS.AUX_STATS$; SNAME PNAME PVAL1 PVAL2 ------------------------------ ------------------------------ ---------- ---------------------------------------- SYSSTATS_INFO STATUS COMPLETED SYSSTATS_INFO DSTART 08-18-2015 15:06 SYSSTATS_INFO DSTOP 08-18-2015 15:13 SYSSTATS_INFO FLAGS 1 SYSSTATS_MAIN CPUSPEEDNW 1020.94011 SYSSTATS_MAIN IOSEEKTIM 10 SYSSTATS_MAIN IOTFRSPEED 4096 SYSSTATS_MAIN SREADTIM .639 SYSSTATS_MAIN MREADTIM .279 SYSSTATS_MAIN CPUSPEED 1067 SYSSTATS_MAIN MBRC 2 SYSSTATS_MAIN MAXTHR 173369344 SYSSTATS_MAIN SLAVETHR 8216576 13 ROWS selected. |
I have cleaned the shared pool from any cursor related to my query with:
SQL> SELECT sql_id,CHILD_NUMBER FROM v$sql WHERE sql_text LIKE 'SELECT /* Yannick%'; SQL_ID CHILD_NUMBER ------------- ------------ a4v04fdrzt14s 0 SQL> SELECT ADDRESS, HASH_VALUE,sql_id FROM V$SQLAREA WHERE sql_text LIKE 'SELECT /* Yannick%'; ADDRESS HASH_VALUE SQL_ID ---------------- ---------- ------------- C0000002B8793888 1878819992 a4v04fdrzt14s SQL> EXEC DBMS_SHARED_POOL.PURGE ('C00000033A233A58, 1878819992', 'C'); PL/SQL PROCEDURE successfully completed. |
Issued the query with the BO universe account limited by database resource manager and finally got a result as Database Resource Manager (DBRM) is now able to better estimate the execution time:
---------------------------------------------------------------------------------------------------------------------------------------------------------------------------------------------------------------- | Id | Operation | Name | Starts | E-ROWS |E-Bytes|E-Temp | COST (%CPU)| E-TIME | Pstart| Pstop | A-ROWS | A-TIME | Buffers | Reads | OMem | 1Mem | O/1/M | ---------------------------------------------------------------------------------------------------------------------------------------------------------------------------------------------------------------- | 0 | SELECT STATEMENT | | 1 | | | | 5212K(100)| | | | 35787 |00:01:46.23 | 2438K| 211K| | | | | 1 | HASH GROUP BY | | 1 | 167 | 51269 | 945M| 5212K (1)| 10:18:29 | | | 35787 |00:01:46.23 | 2438K| 211K| 274M| 15M| 1/0/0| |* 2 | FILTER | | 1 | | | | | | | | 500K|00:00:55.59 | 434K| 211K| | | | |* 3 | HASH JOIN | | 1 | 2662K| 779M| 7300K| 134K (2)| 00:16:00 | | | 500K|00:00:53.54 | 228K| 211K| 10M| 2310K| 1/0/0| | 4 | TABLE ACCESS BY INDEX ROWID| AFINISHED_GOOD | 1 | 51906 | 6691K| | 9736 (1)| 00:01:10 | | | 56143 |00:00:00.37 | 16322 | 0 | | | | |* 5 | INDEX RANGE SCAN | AFINISHED_GOOD_IDX_PGRP | 1 | 51906 | | | 52 (2)| 00:00:01 | | | 56143 |00:00:00.03 | 56 | 0 | | | | |* 6 | HASH JOIN | | 1 | 2695K| 449M| 50M| 116K (2)| 00:13:52 | | | 2678K|00:00:49.97 | 211K| 211K| 75M| 5505K| 1/0/0| | 7 | TABLE ACCESS FULL | ACUSTOMER_SHIP_TO | 1 | 772K| 41M| | 39313 (2)| 00:04:40 | | | 772K|00:00:12.13 | 76106 | 76100 | | | | | 8 | PARTITION RANGE ALL | | 1 | 2678K| 303M| | 71001 (3)| 00:08:26 | 1 | 12 | 2678K|00:00:31.66 | 135K| 135K| | | | |* 9 | TABLE ACCESS FULL | HINVOICE | 12 | 2678K| 303M| | 71001 (3)| 00:08:26 | 1 | 12 | 2678K|00:00:30.33 | 135K| 135K| | | | |* 10 | TABLE ACCESS BY INDEX ROWID | USER_X_ORG | 103K| 1 | 55 | | 2 (0)| 00:00:01 | | | 103K|00:00:01.10 | 206K| 1 | | | | |* 11 | INDEX RANGE SCAN | USER_X_ORG_IDX_NAME | 103K| 2 | | | 1 (0)| 00:00:01 | | | 103K|00:00:00.59 | 103K| 0 | | | | ---------------------------------------------------------------------------------------------------------------------------------------------------------------------------------------------------------------- |
Remark:
If the figures are a bit different it is because BI team deleted in parallel old years of figures from fact table as they have forgotten. To be honest this is exactly a situation where it makes sense to have database resource manager to forbid big queries from running. And obviously the 12 hours limit that has been set does not help at all…
So clearly the system statistics play a key role in estimating execution time of queries and looking at figures you tell to optimizer when gathering system statistics is make a lot of sense…
References
- How to Determine that a Query is Optimized Using CPU Costing in 10g and above (Doc ID 743834.1)
- Using Actual System Statistics (Collected CPU and IO information) (Doc ID 470316.1)
- How to Collect and Display System Statistics (CPU and IO) for CBO use (Doc ID 149560.1)
- System Statistics: Scaling the System to Improve CBO optimizer (Doc ID 153761.1)
- System Statistics
- Understanding the different modes of System Statistics aka. CPU Costing and the effects of multiple blocksizes – part 1